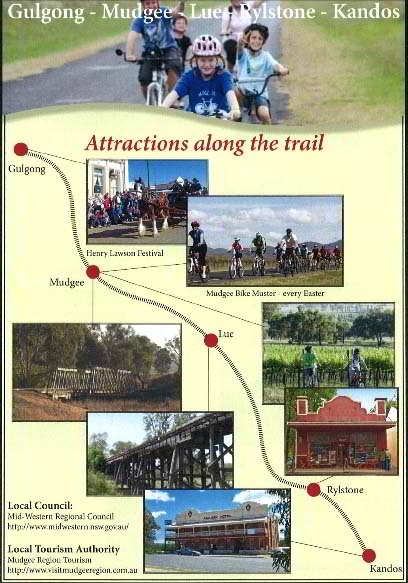
Overall vision is connecting the Sydney cycling network with Bathurst, Orange, Dubbo and Mudgee via the World Heritage listed Blue Mountains and Wollemi Wilderness. In 2020, the Central West bike Trail was established, as was the remaining link across the Blue Mountains. Now, the Newnes (Wolgan Valley) Rail Trail needs to be connected with the Kandos to Mudgee Rail Trail or simply a Cycle Trail parallel to the abandoned railway line.
ie connecting "the Dubbo Sky to the Sea"
(Martin Krause)
This concept was originally conceived whilst pack cycling the Rail Trails of the Route Verte in Quebec in 1998. In 2015, the Mountains to the Sea concept was adopted and analysed in British Columbia by the Squamish community, as part of the Vancouver to Whistler pack cycling trail.
"Total spending in Squamish attributable to mountain biking totalled
nearly $2.1 million over the period June 4 to September 17, supporting
an estimated $1.9 million in new economic activity (GDP)."
https://www.mbta.ca/wp-content/uploads/2016/02/FINAL-Squamish-EI-Study-Dec-15.pdf
"A majority (55%) {of cyclists} had household income levels greater than $80,000. As a datapoint 31% of all BC outdoor recreationalists had household income levels greater than $ 80,000. Mountain biking visitors were generally in line with all tourists to Canada going on guided tours (59% had incomes of greater than $100,000)"
https://www.pinkbike.com/news/economic-impacts-of-mountain-biking-tourism-2014.html
After a quarter of a century of fighting - a miracle appeared on the front page of the AFR in 2021
On 20 October 2021, the Federal Australian Treasure, Josh Freydenburg, appeared on the front page of the Australian Financial Review, declaring the $6.3 Billion Australian cycling economy. The report was created by EY. It highlighted the following :
- 5.8M or 29% of adults aged 18 to 90 – the estimated number of Australian adults who spent money on cycling-related goods and services.
- 1.7M new bikes were sold
- 28% of new bike sales were children’s bikes.
- $990 – the average annual spend on cycling related goods and services.
- Fitness was the primary motivation for cycling.
- Recreational road cycling is the most popular form of the activity making up 69% of respondents.
- 52% said they ride a stationary or indoor trainer.
- Between 2019 and 2020 the annual number of bike imports increased from 1.2M to 1.7M.
- State and Local Governments spent $428M on cycling infrastructure and promotion in 2020.
Link to report : https://bicyclingaustralia.com.au/wp-content/uploads/2021/10/The-Australian-Cycling-Economy_October-2021-Updated.pdf
Second miracle in a month - 13 November 2021
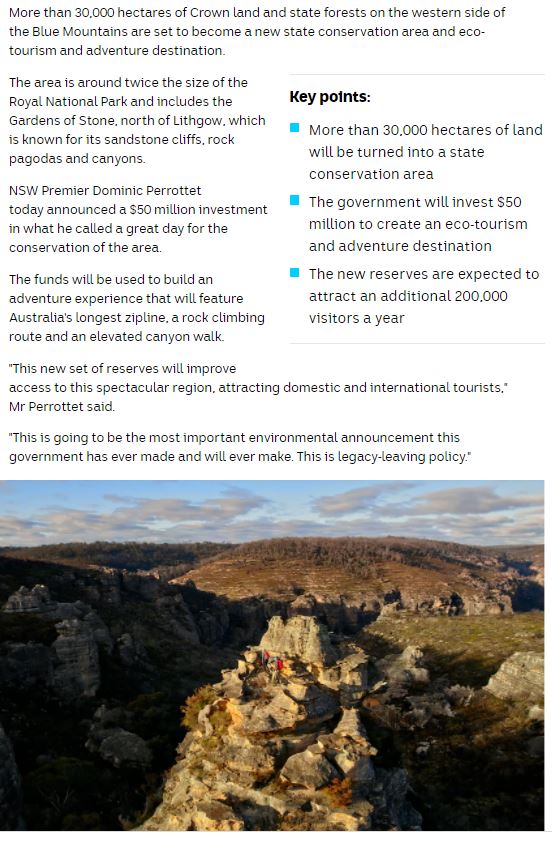
NSW state government anounces $50 million to the conservation of the Gardens of Stone State Forest with the creation of an eco-tourism sight close to Lithgow, including 35km of MTB trails.
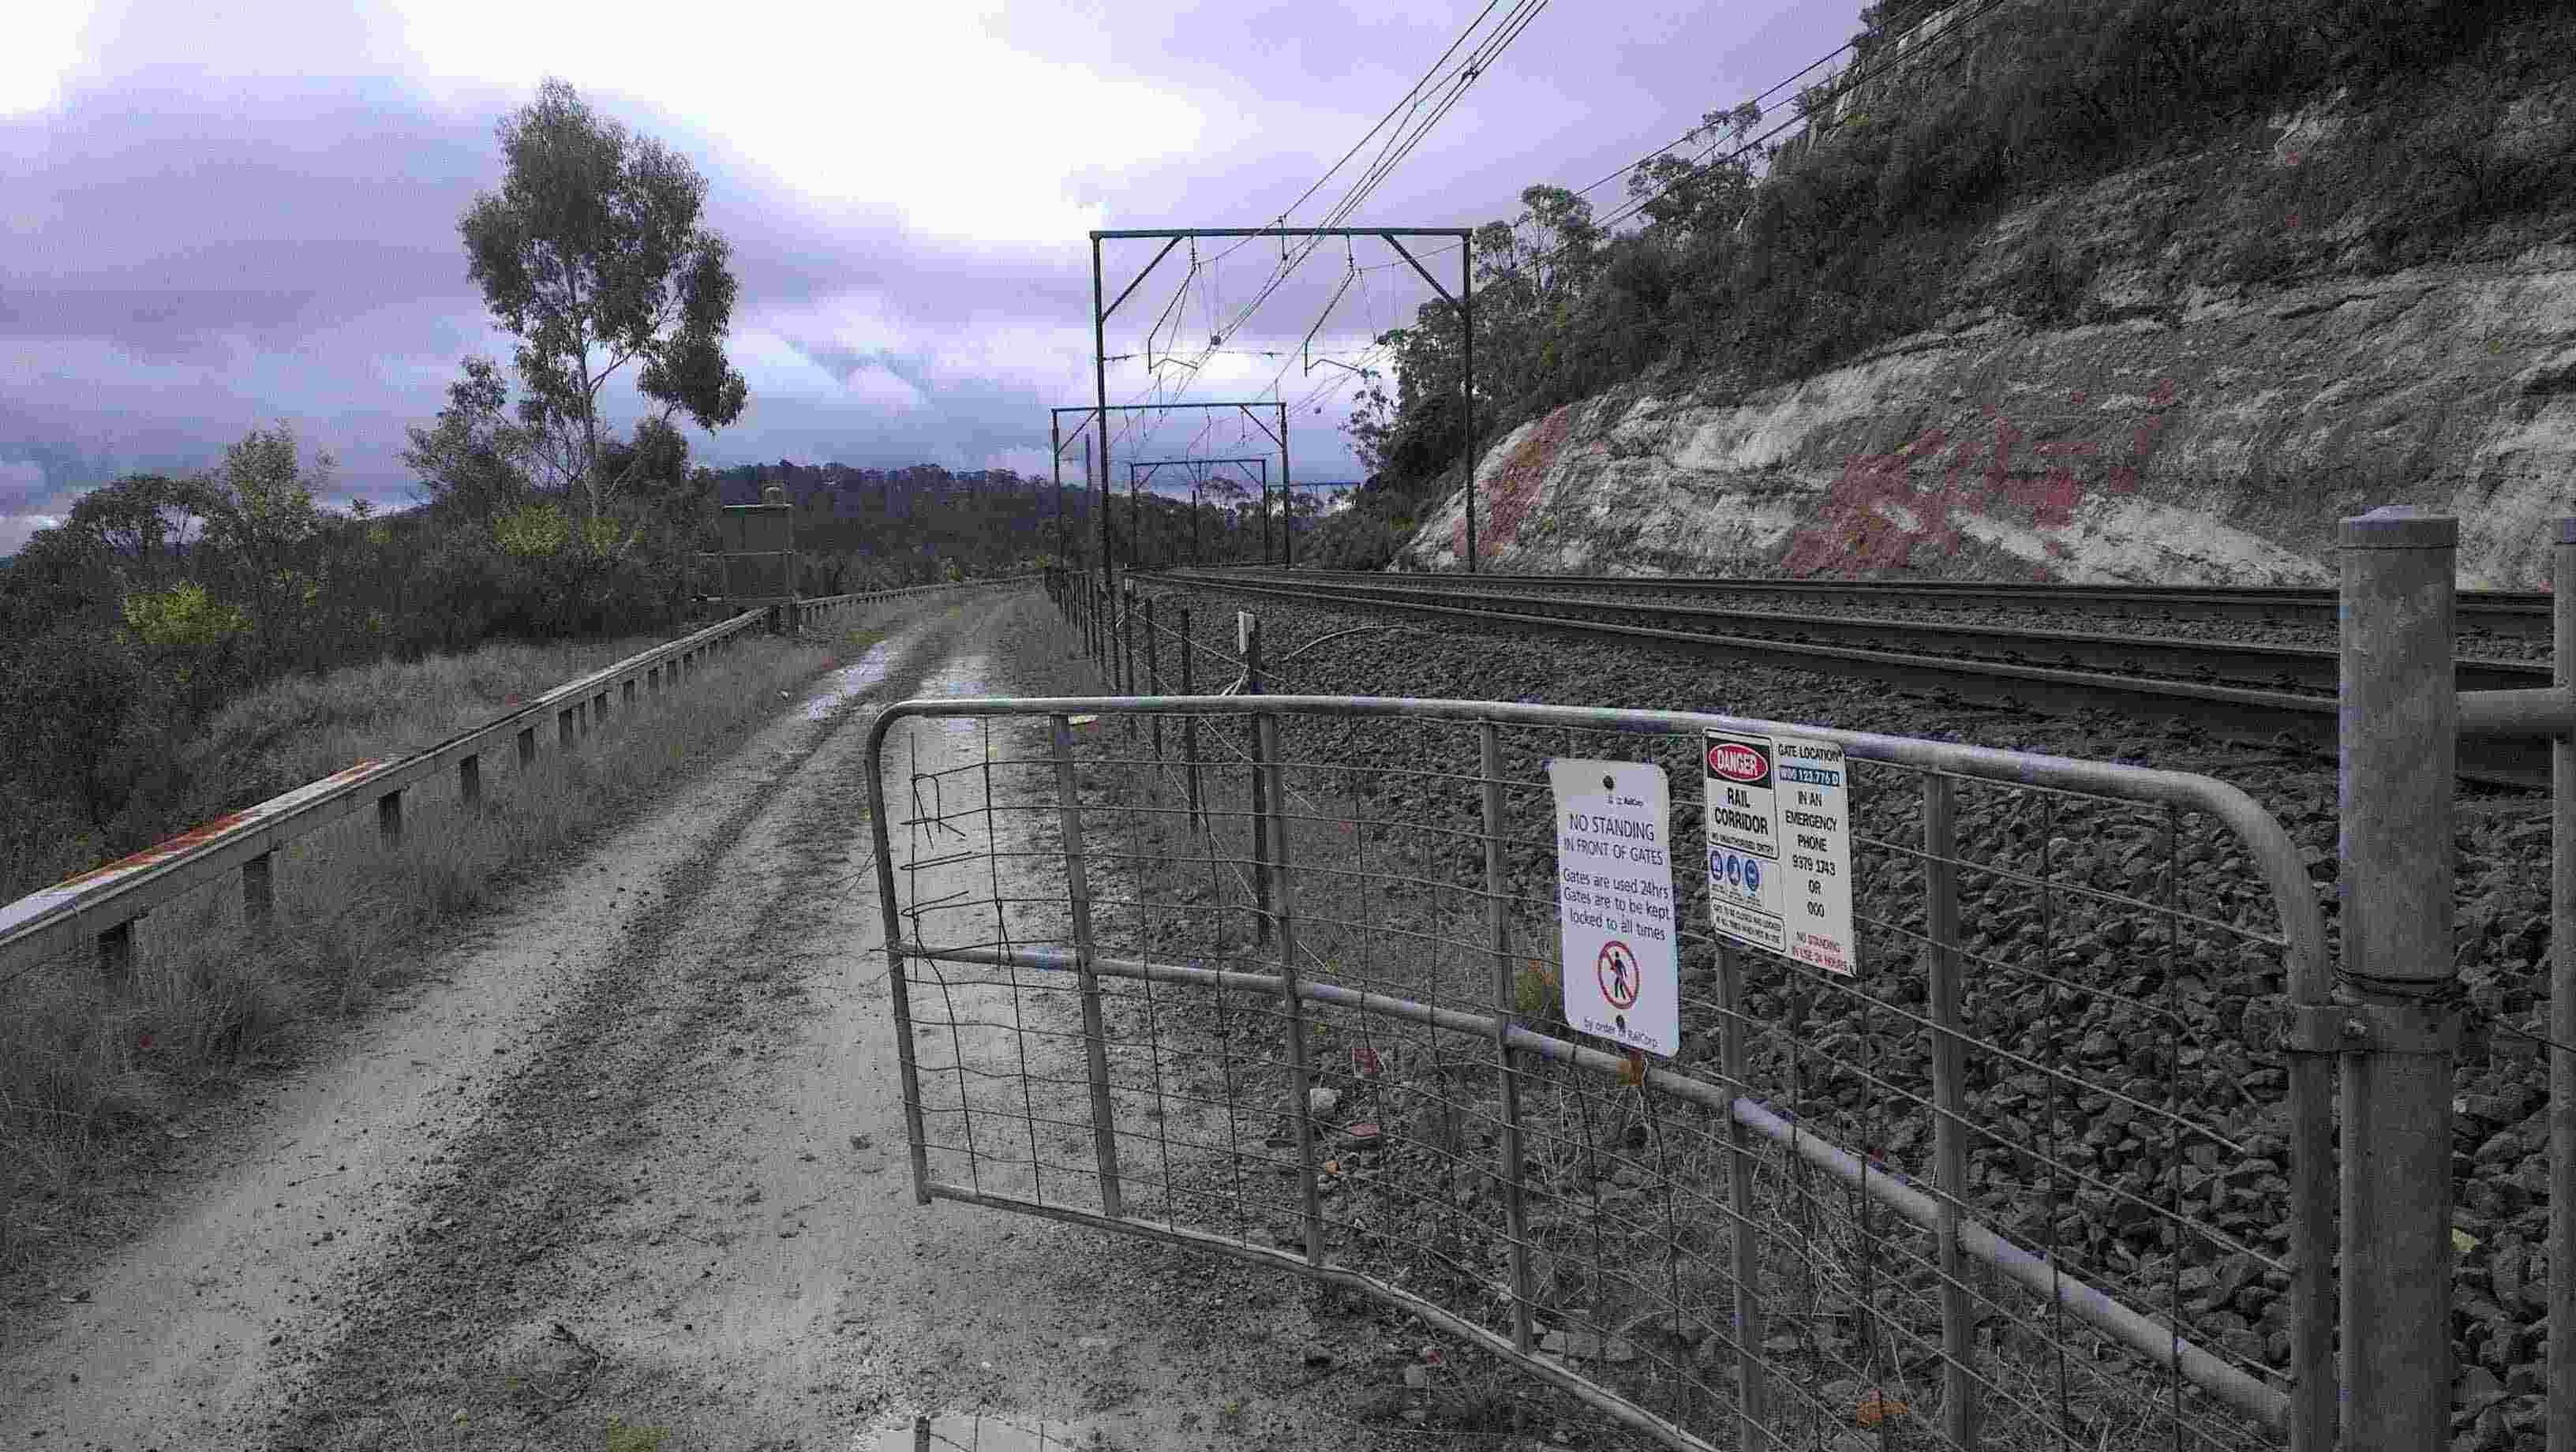
RailCorp - rail corridor impass
Rationale (health and economics) for the development of the trail
Cycling participation in Australia
Trails beside Rail or Rail Trail
Blackheath - Mt VictoriaUpper Blue Mountains Rail Trail Lower Blue Mountains Zig Zag Rail TrailHealth 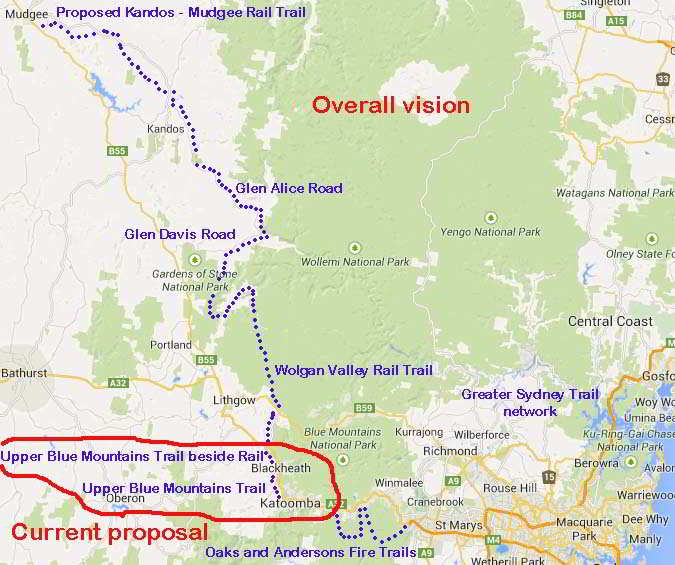
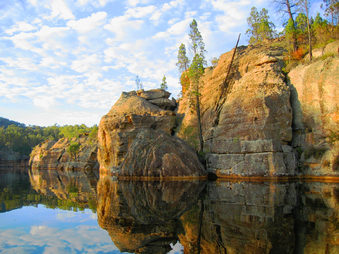
Wollemi National Park
Manly to Mudgee
The concept of linking disparate cycle paths, Rail Trails (Newnes Rail Trail and Kandos-Mudgee Rail Trail) and fire trails to create a 300km cycling odyssey. Most trails already exist. Upgrading and linkage is needed. Thereby, creating a cycle randonneur/pack cycling/cycle touring experience.
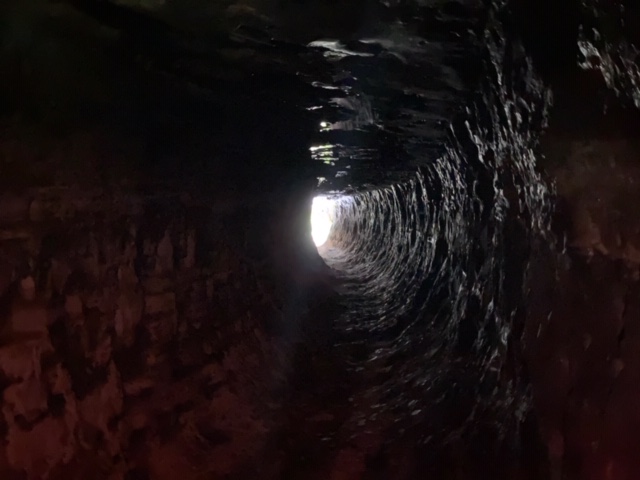
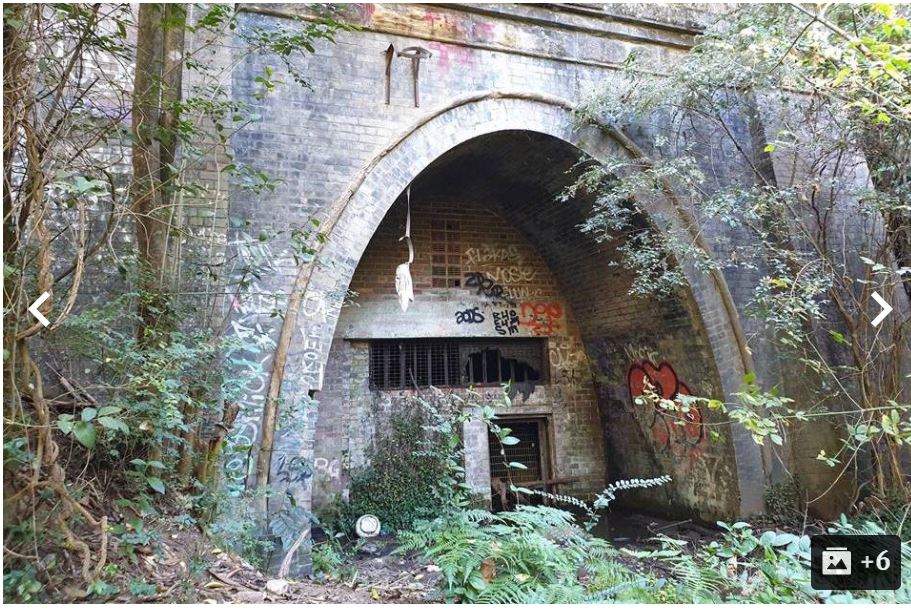
Newnes Glow Worm Rail Tunnel (2020)
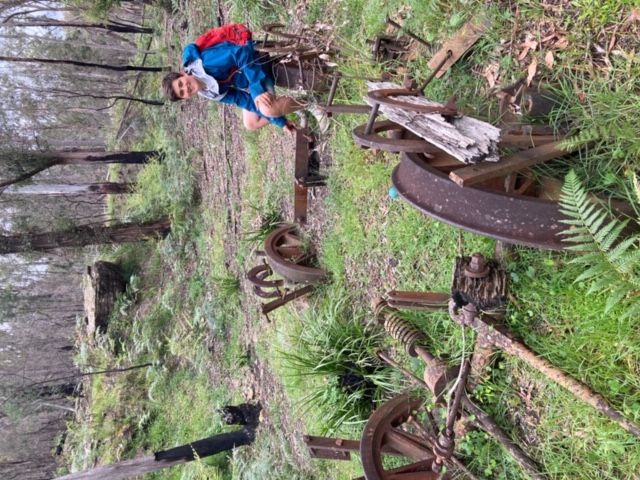
Carriage ruins of Wolgan Valley Rail Trail (October 2020)
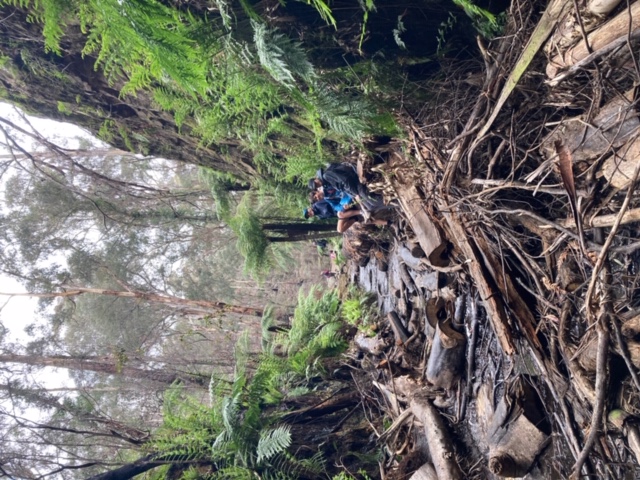
Old cutting (October 2020)
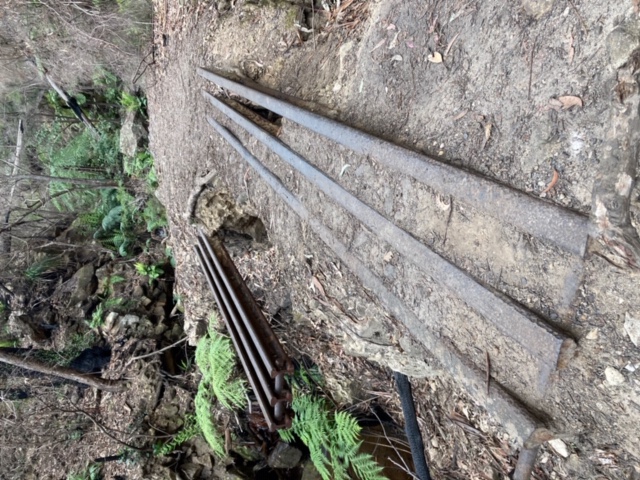
Evidence of previous rail (October 2020)
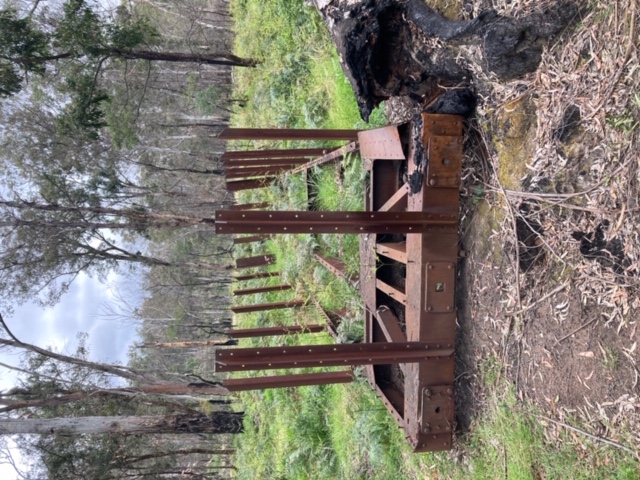
Old Carriages (October 2020)
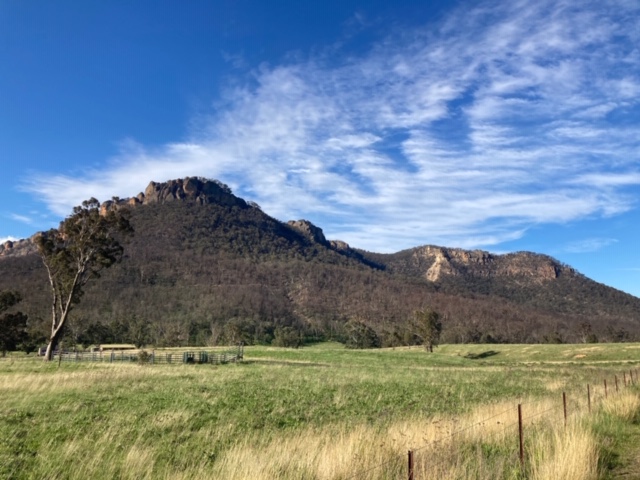
Wolgan Valley (October 2020)
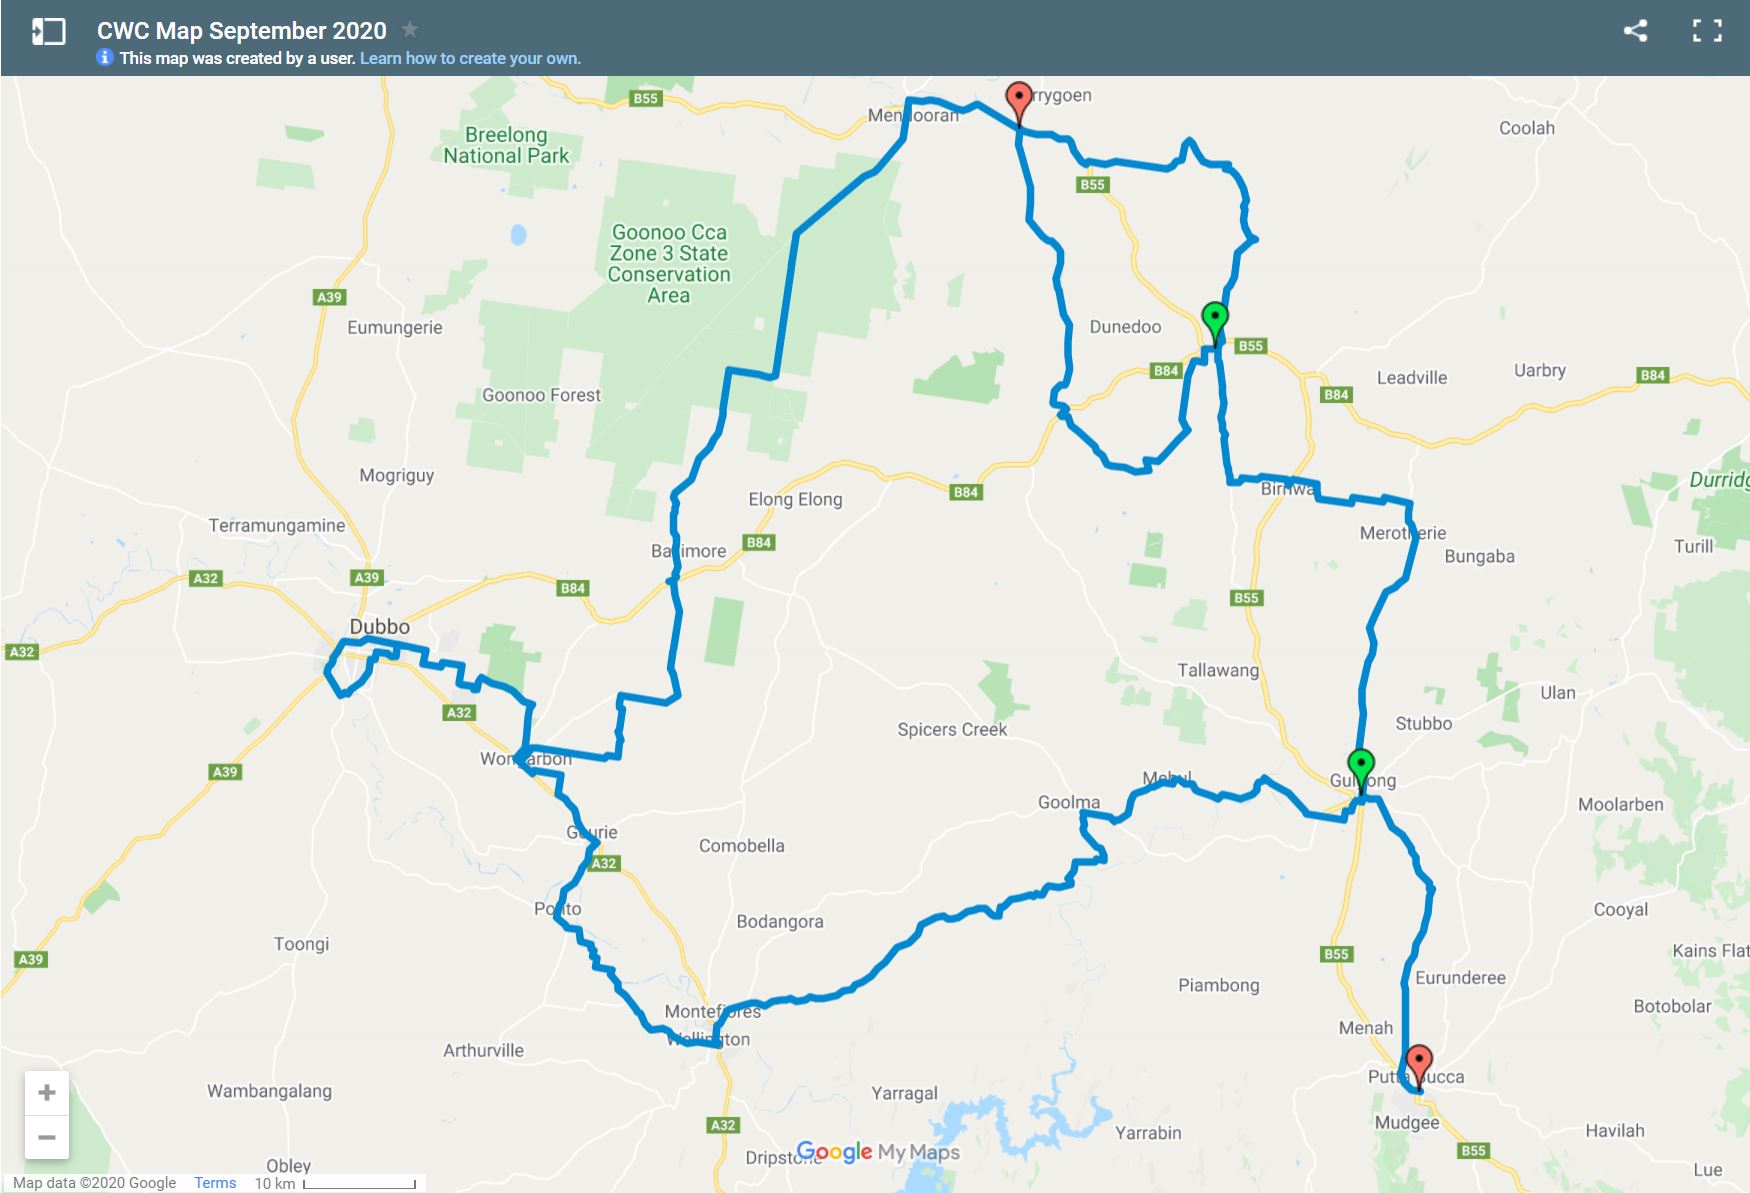
Central West Bike Trail (September 2020) : Manly to Dubbo
Imagine linking the Central West Bike Trail with Sydney????!!!!!!!
Background
The concept of a Trail following the Rail was brought to the attention of Blue Mountains City Council in 1998 through the presentation of a petition, which included over 1000 signatures. The objective was to open one of several tracks, which follow the railway line, to public use as an off-road biking and hiking trail between Wentworth Falls and Mt Victoria. Several issues arose with this proposal. These issues included Sydney Water Catchment area, several non-integrated and stratified government departments, questions ownership of the land adjacent to the railway line, safety - including the surface of the track, fencing, and gradients, environmental impact, as well as the cost of building as well as maintaining another BMCC asset such as this track.
At the time, public access to the track between Medlow Bath and Blackheath already existed. However, the track between Katoomba and Medlow Bath went through Sydney water catchment land, but was still used illegally by commuting mountain bikers. This illegal use was necessary, as the Great Western Highway had extremely large amounts of heavy traffic on a very narrow road. The track to the west of Blackheath essentially followed an existing suburban street until it became railway land. Although car access had been developed and granted to rock climbers, early in the 1990's, by the late 1990's, there was a reluctance to grant similar access to cyclist and worse still a fence was erected half way along this strip to prevent any through traffic, hereby only allowing access from the west for climbers and their cars. A similar situation existed between Leura and Katoomba, where illegal bike commuting access was occurring along the southern side of the railway line. In this instance, this was occurring because the road trip between the 2 towns involve very steep hills, whereas along the railway line the gradient was extremely modest.
A public information campaign was launched through the Blue Mountains Gazette, as well as approaches to BUG's (bicycle user groups) in the Blue Mountains and Bathurst, schools, TAFE, outdoor communities, NPWS, as well as various Chamber of Commerce (esp Wentworth Falls and Lew Hird in particular), Blue Mountains Tourism as well as Blackheath and Mt Victoria community action groups. The former headed by Liz Bastian. Interestingly, both labor, liberal and some independent councillors and politicians mooted for the project. Surprisingly, the people who were least helpful were Bicycle NSW and the Greens!!!!
Correspondence was entered into with NSW state and Federal governments across many departments, including local sitting members, departments of transport, environment, health and tourism. Several meetings were held with many members of staff and people from the local community at BMCC, which were co-ordinated by Glen Sherlock. I personally invested a lot of my time investigating every plausible reason for constructing such a trail, by looking at comparative projects interstate and overseas, as well as investigating the nature of 'trusts' to take 'ownership' and maintain an on-going commitment to the maintenance and development of the asset.
Through continuous lobbying, the NSW labor government conceded the need for safe cycling across the Blue Mountains by agreeing to build wide cycling tracks along the great wester highway during it's upgrading. The completion, in 2012, of the cycling track between Wentworth Falls and Bodington Hill is an example of this, and represents a vital link to the well frequented Andersons and Oaks fire trails between the upper, mid and lower Blue Mountains towns of Wentworth Falls, Woodford and Glenbrook respectively.
Additional considerations were, that this cycle path created an important 'backbone' to accessing cycling facilities either side of the trail, with cross country mtb'ing trails at Katoomba, Blackheath, Mt Victoria and road cycling into the Megalong Valley. Additionally, it formed an essential part of the Manly to Mudgee and the Dubbo pack cycling trail, which again had cycling facilities either side of it, These places included Hassans Walls Gravity Trails in Lithgow, Rydal cross country trails near Lthgow, Wolgan Valley and Newnes Plateau, Oberon, Clandulla near Kandos, Dunns Swanp and Rylstone. Finally, the central west pack cycling route from Mudgee to Dubbo return circuit became a great sensation for family and friends cycle toruing during the COVID-19 crisis of 2020-21.
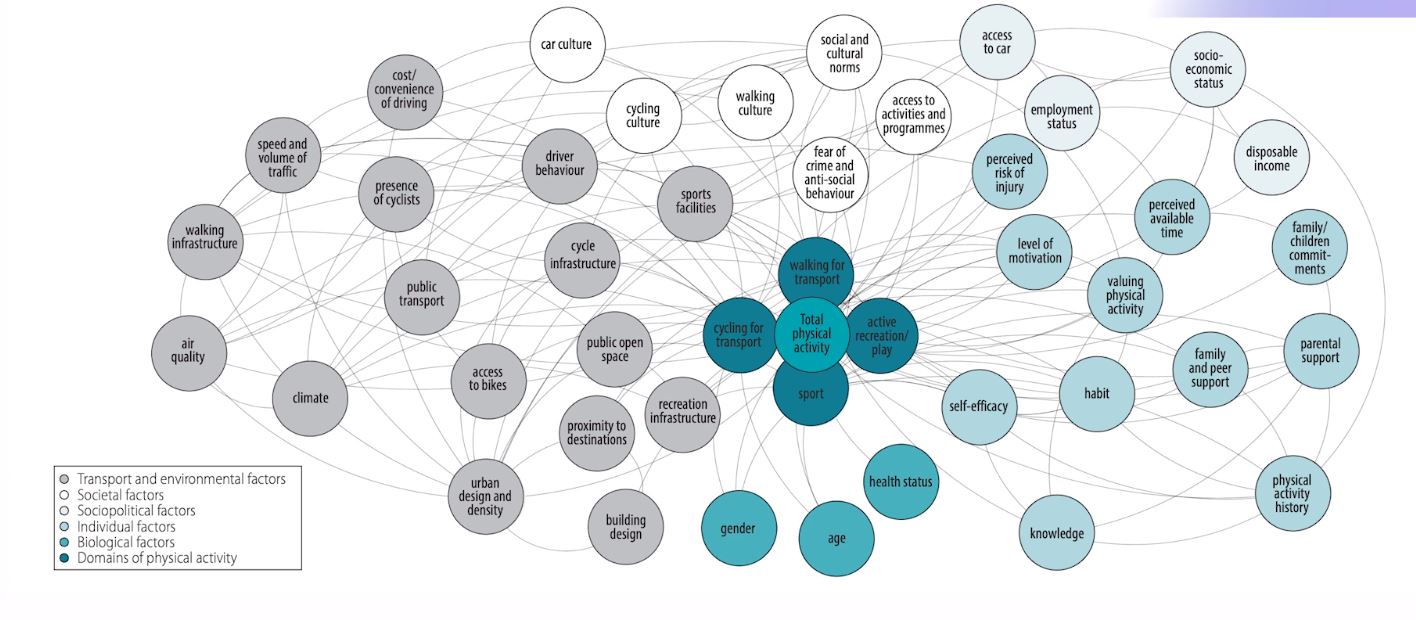
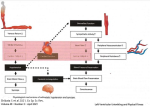
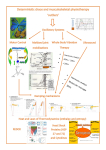
Active transport for personal health and the health of the environment - systems map of factors contributing to uptake (Rutter H et al 2019 Bull World Health Organ)
Backdrop : 2011
Cycle Tourism: Events and tourist trails generate $254 million a year in Australia
- $9.6 Billion : Car trips cost 5.9¢ a km in CO2, air, water and noise pollution. In 2010 we drove cars more than 163 million km
- Regular bicycle riders take one less sick day than non-riders, saving businesses $61.9 million a year
- The Australian bicycle industry employs 10,000 people and generates $139 million income tax revenue.
- Inactivity costs Australia $13.8 billion a year. Everyday cycling can provide recommended activity levels and reduce this cost.
- Bike and accessories are worth $1 billion a year, generating $100 million gst revenue
- 4 Million people: 18% of Australians cycle in a typical week, 1.6 million use their bikes for transport
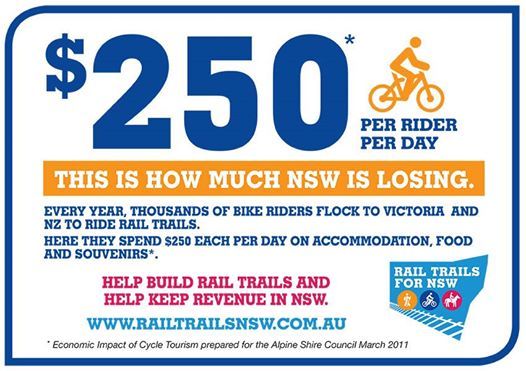
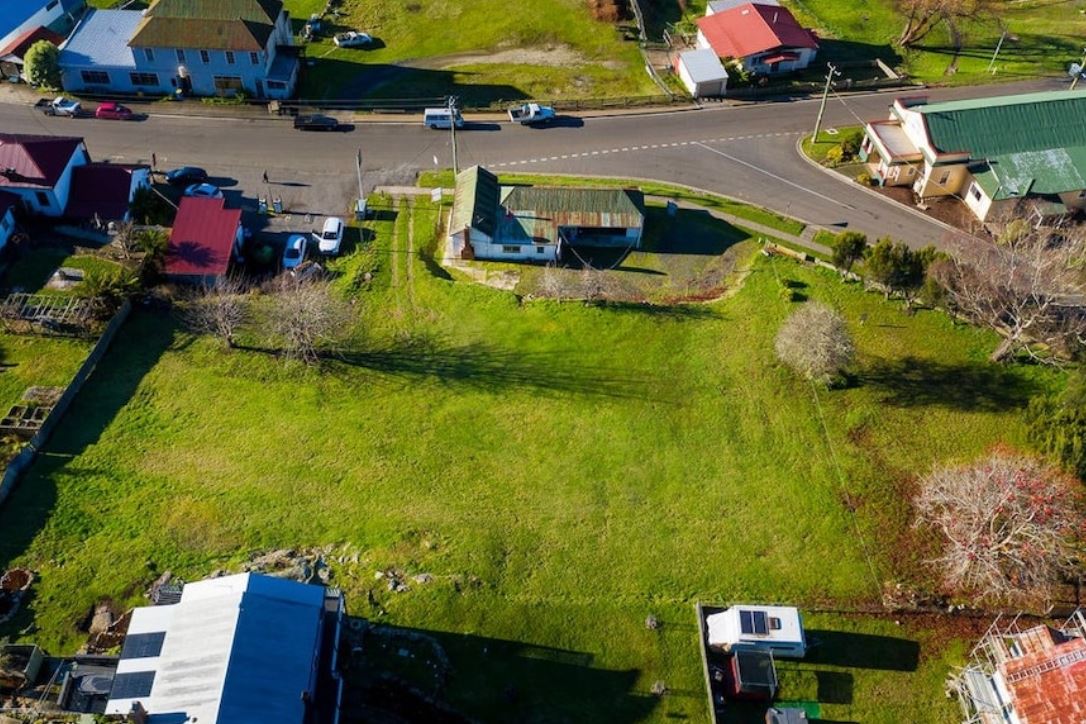
Economic Impact - Real Estate : Derby Tasmania : September 2021 National News - ABC
Many investigations into Rail Trails in North America eluded to the beneficial impacts of RT's on the liveability, connectedness, and quality of life that a RT brings to a health minded recreationally oriented community. Additionally, disused rail corridors and abandoned towns suddenly get a new lease of life. Even crime reduces in these regions. These factors all have a positive impact on real estate prices in a community serviced by cycling infrastructure.
In September 2021, a dilapidated 2 bedroom 100 year old shack sold, in Derby, Tasmania for a record $1.3 million. 10 years previously it had sold for $160 000. The real estate agent was quoted as saying "I've never had so many calls about a property before … I would have easily had hundreds of calls and texts and emails."
What happened???? World class, cross country, enduro and epic mountain biking trails. A government investment of $4 million turned a virtual 'ghost town' into a must do, go to, international and domestic mountain biking destination!!!
"One hundred years ago people were coming back from World War I, new businesses were opening here, mining was heating up again, and now here we are 100 years later and it's mountain biking, not tin.
https://www.abc.net.au/news/2021-08-31/derby-crack-house-sells-for-1-3-million/100419092
The following are Lithgow neighbourhood insights from Domain real estate in September 2021.
This could be Lithgow : a community transformed from coal mining and a jail to a progressive mountain biking destination with all the economic windfalls which go with them. Improved liveability and quality of life through the economic boost from cycle tourist spending creates a mosaic of recreational activities as well job opportunities.
Rocky Trail has held Downhill races at the Pony Express, endorsed by the local MTB club, for about 10 years until 2016/2017. It has been difficult for the club to maintain the trails as the downhill market is in decline – this is why we propose the Superflow-style of trails in this project as they will attract a broad range of mountain bikers not just to events, but also for ongoing visitation.
Rocky Trail’s ultra-endurance event, the Jetblack 24 Hour has had its home in Lidsdale State Forest in Rydal since 2017. Attracting Australia’s top endurance and marathon racers, it has become a hugely popular event with the casual mountain bike riders and racers thanks to the uniquely comfortable set up of the event village, which we have been able to achieve in Rydal.
The 2019 edition of the JetBlack 24 Hour with its JetBlack 6+6 Hour offspring took place at Rydal Showgrounds near Lithgow on 23+24 March 2019. More than 300 race competitors from all over NSW and the ACT raced in teams of up to 6 in the 24 Hour competition and up to 4 in the 6+6 Hour event, clocking in almost 2,900 laps and recording more than 27,500 racing kilometers over the weekend.
The Jetblack 24 Hour once again transformed the Rydal Showgrounds in Lithgow into a vivid mountain bike event centre and tent village over the weekend with 435 racers and overnight event visitors plus an est. 50 local spectators, injecting more than $250,000 into the local economy.
Entering its second decade the 11th edition proved that the 24-hour racing concept is more and more becoming a social affair: more than a third of all racers competed in the teams of six-classification – and whilst everyone from solo to team participant races hard and gives into this unique endurance challenge, it’s all about that fun weekend away with fellow mountain bikers, family and friends - and this aspect is what we will put a strong emphasis on for the future promotion and growth of this event.
https://www.councilnews.com.au/2021/03/15128116-draft-hassans-walls-mountain-bike-trails-strategy
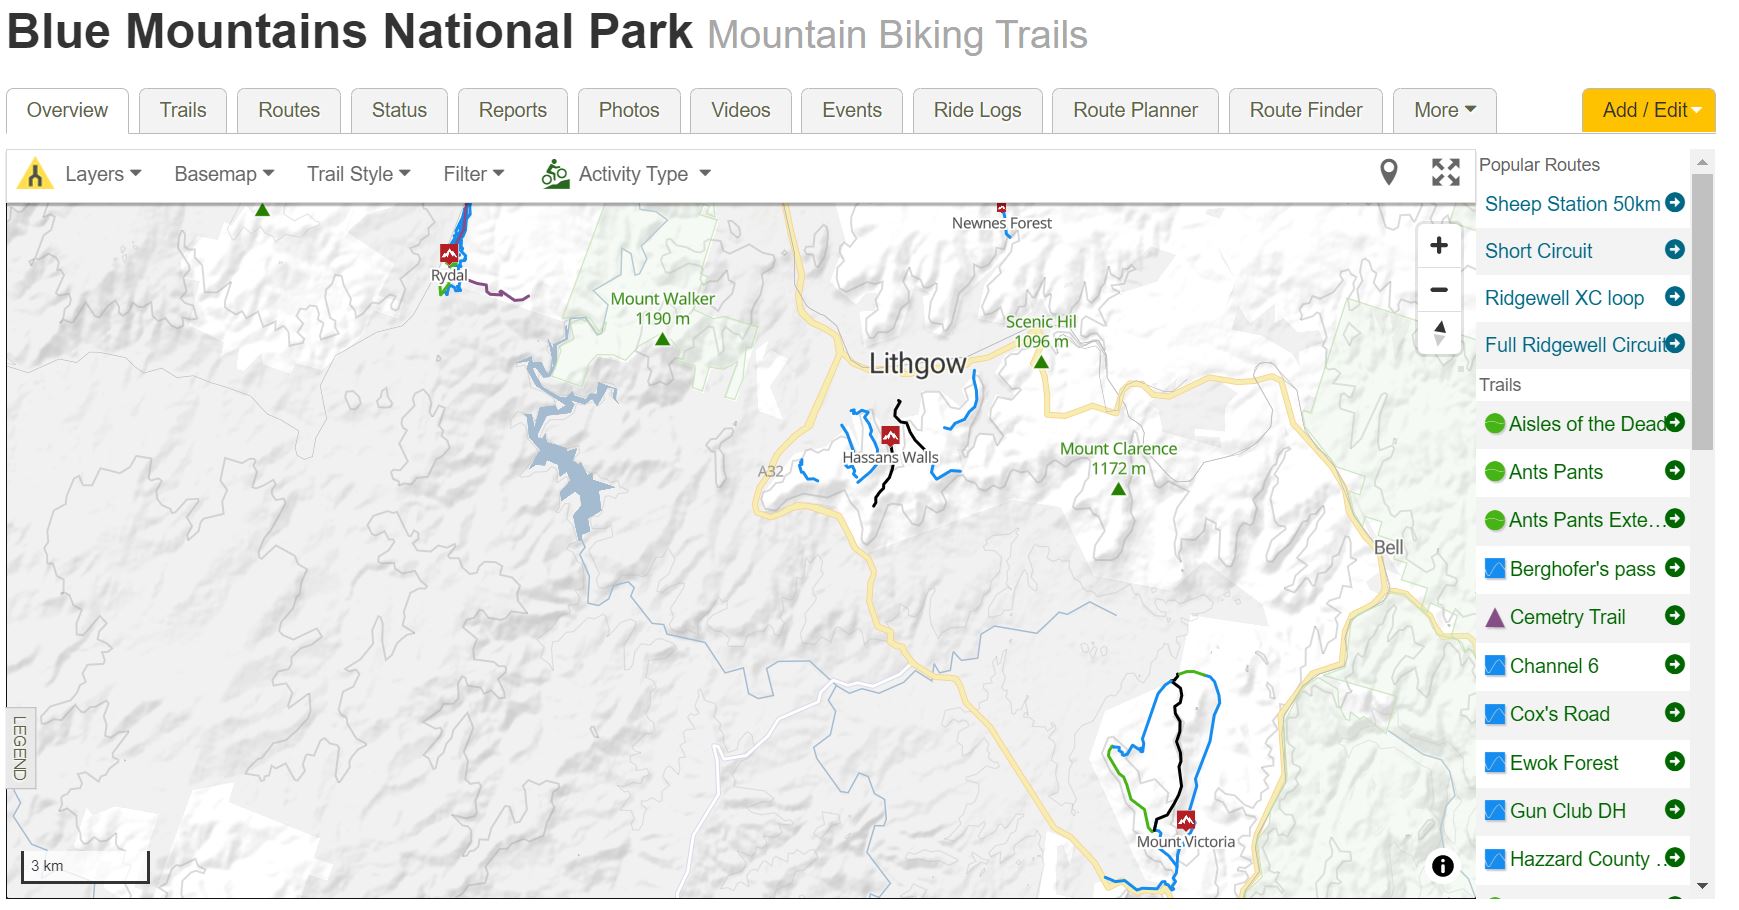
Lithgow could be one of the hubs of the Manly to Mudgee and Dubbo bike packing trail as well as an ultimate destination for downhill mtb'ing. Similar to how Tasmania was, Lithgow struggles as a tourist destination. Tasmania used to have tourists who came to see convict ruins, which is probably similar to a country as beautiful as Poland marketing itself as a 'concentration camp' destination - 'welcome to the gates of hell', Now, rather than the horrors of Port Arthur, it's a wine, food, cultural and sporting outdoor destination. Tasmania markets itself as such and now has a high influx not only of tourists but also of people relocating for it's liveability. Lithgow with it's geographic proximity to Sydney and the iconic World Heritage Blue Mountains, as well as the gateway to the west, can become an even better place to live.
Derby, in Tasmania, is an example of how mountain biking can kick-start an economy. “A ghost town of just 173 people just three years ago, Derby is now a renowned MTB hotspot that generates $23 million a year.”
https://www.mtba.org.au/wp-content/uploads/CCJ17427-Blue-Derby-Case-Study.pdf
There are currently about 90 km of trails in the Blue Derby network. It is not necessary to build such a large network of trails to gain significant economic benefit. Small mountain bike projects can attract similar visitor numbers to large-scale projects.
Smithfield Mountain Bike Park in Queensland is only 16 km from Cairns. It has approximately 25km of trail and sees 33,600 users per annum.
Forrest in Victoria, a 1.5-hour drive from Melbourne has 65km of trail and sees usage volumes of between 22,000 – 25,000 per annum
The Wild Mersey project in Tasmania is a great example. Due to its proximity to population centres, the 16km section of stacked loops in the Warrawee Reserve has seen usage volumes similar to that of Blue Derby, with 25,000-30,000 users annually.
Other examples of gravity trails include Maydena, about an hours drive from Hobart, Tasmania and Whistler, Canada, which makes more money from cycling than it does from winter sports.
The seminal MBTA 2007 study Whistler Report is the one most commonly used as a baseline. Surprisingly it showed that over half (52%) of Whistler visitors weren't there for the bike park but for the Whistler valley's exceptional trail system. Bike park ridership was greater though due to number of repeat visitors (76,600 bikepark vs 25,000 trail for the mid June to mid Sept study period). There was less than 10% crossover between bikepark and valley trail riders showing that the trail system, in and of itself was a significant draw. A large majority (70% were male). Another large majority (68%) were non-locals. Riders in Whistler (including bikepark and trails) were predominantly in the 30-39 category (37%) with bikepark riders being generally older than trail riders. Visiting riders were strongly represented by 18 and under year olds (18%) which brings down the average age making visiting riders in Whistler relatively younger than for any other area with an EIA (except for Moab where the average age of visitors was also younger). Living in Whistler I would hazard a guess that there is a noticeable subset of younger travellers who are more budget-conscious that travel to this core name-brand destination but the younger demographics' average dollar spend isn't significant.
As to spending, 90% of visitors were overnight visitors. Both bikepark and trail riders stayed a fairly long time (4.5 to 5 nights). Bikepark riders spent more per day ($133) vs trail riders ($94) - but taking out the price of the bikepark passes, trail riders spent more. International/oversea visitors spent the most, stayed the longest (7 nights) but spent less per day on average; probably because lodging costs drop as you stay longer. Income of riders was all over the place with the bell curves having fat tails at bottom and top end (ie fair amount of budget mixed in with bling but with lower incomes predominantly among trail riders). https://www.pinkbike.com/news/economic-impacts-of-mountain-biking-tourism-2014.html
A 2014 Squamish (just down the road from Whistler and up the road from Vancouver) study found that 75% of trail users were visitors (a large increase); jumping to 85% on the Half Nelson landmark trail. The factor dropped considerably over the past 7 years with male percentage dropping to 55% showing that Squamish trails drew increasing female ridership. The study counted 1339 riders over a three day weekend. A conservative projection estimated rider counts at 1920 visitors/week; 640 locals/week. It was then projected that 25,000 riders visited Squamish on just weekends over the riding season (26 weekends) roughly doubling that number when including weekdays. 40% stayed overnight spending $ 215 per person per trip or approx $80/day (average stay was 2.5 days). Day visitors spent $ 37 per day.
Economic benefits of mountain biking for 'tiny towns' are further detailed in https://adventure.com/mtb-mountain-biking-saving-tiny-towns/. Although Lithgow isn't a tiny town, the potential economic impact is never-the-less clear.
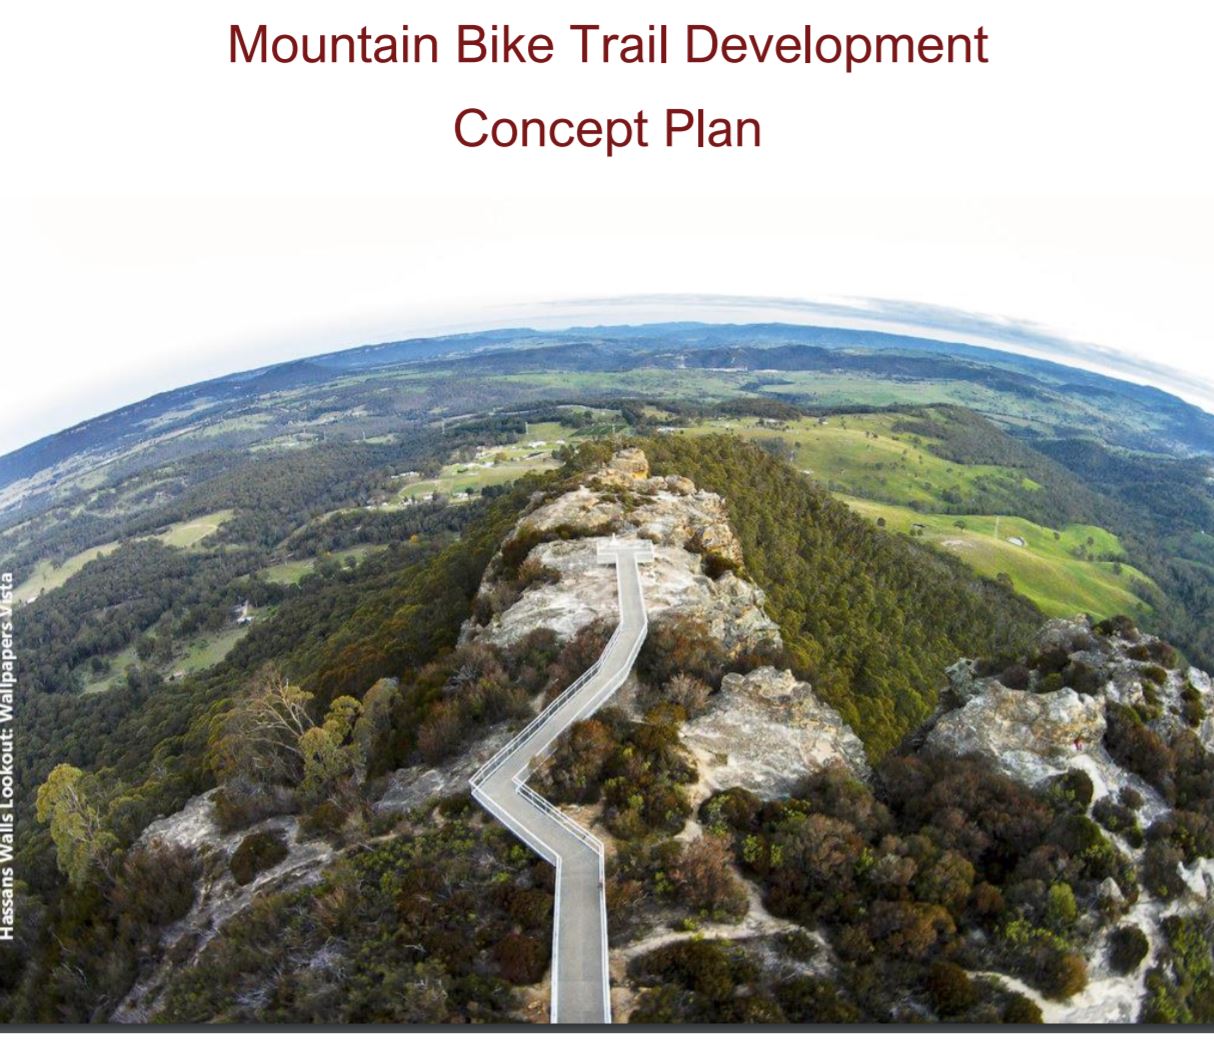
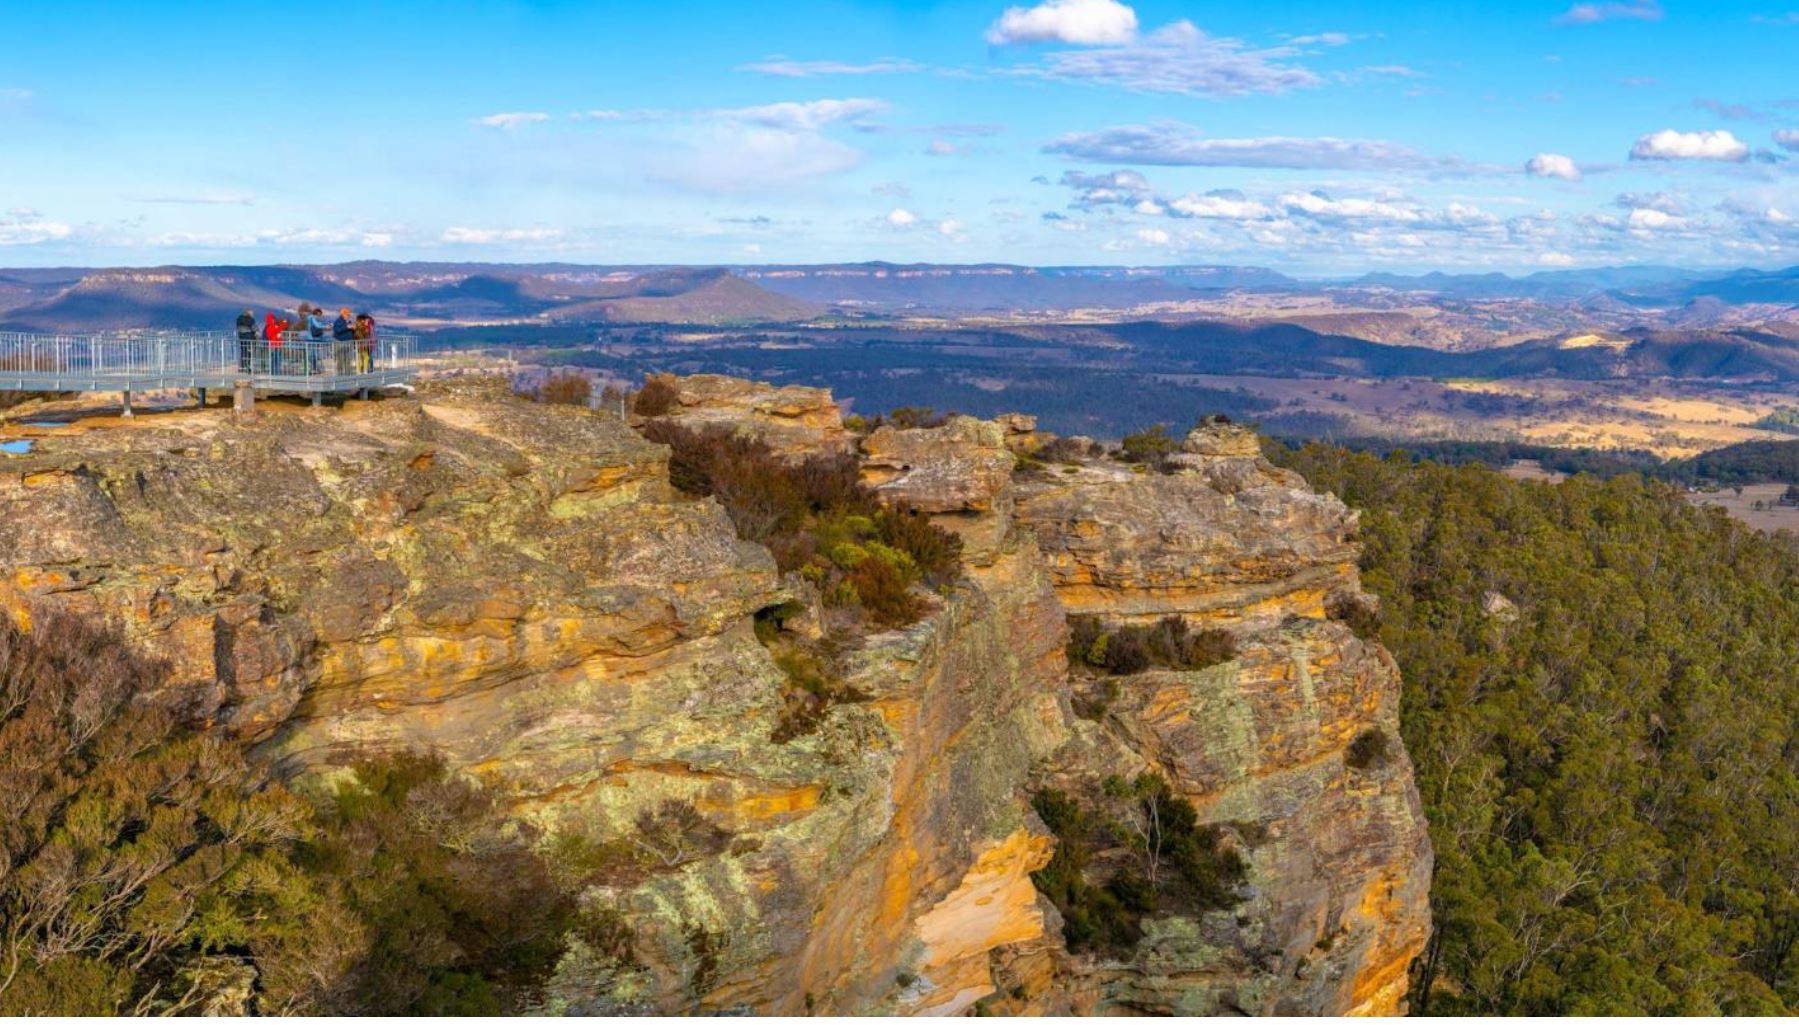
Hassans Walls lookout, Lithgow, Australia
The effect : 1998-2003
BMCC received funding from the State Government , Dept Planning as part of the Greenspace Program to undertake the feasibility study which was completed in 2010. They again applied for funding from the same program in 2011 to undertake a Review of Environmental Factors (REF) for the trail which was completed in March 2012 and a Signage and facilities Plan was due for completion in June 2012. Both the REF and Signage Plan were requirements from the Dept Planning.
It was the intent of BMCC that during the next round of grants in September 2012 from the Greenspace Program that they apply for funds to begin construction.
BMCC also made application to the various State/Federal stimulus fund rounds without success until 2013.
After 15 years of campaigning, in 2013, Federal Labor Government make a funding announcement to develop the trail as far as Lithgow.
The Federal Labor Government today announced it would contribute $500,000 towards the construction of a new walking and cycling track in the Blue Mountains.
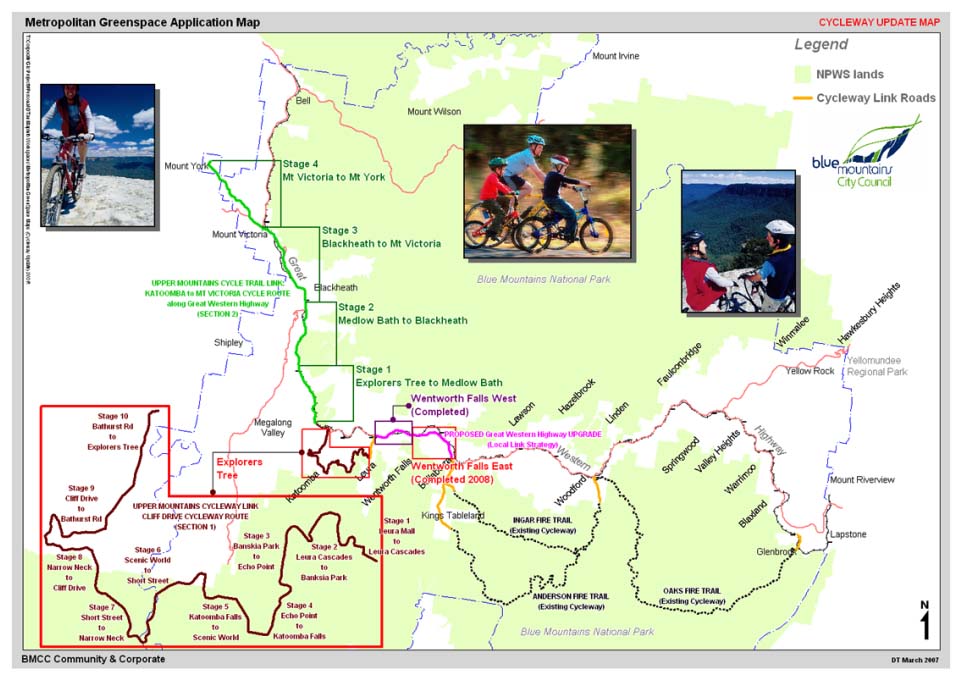
This funding is for the second section of the Great Blue Mountains Trail which will add 13.2 kilometres of new walking and cycling track linking the towns of Katoomba, Medlow Bath & Blackheath.
Minister for Regional Development and Local Government, Anthony Albanese said the trail would add to region's appeal as a walking and cycling destination.
"Tourism is the primary economic driver in the Blue Mountains region and the trail will provide a new and interesting visitor experience and bring a positive economic impact," he said.
"The new trail will generate tourism spending by New South Wales, interstate and overseas visitors and support local businesses associated directly with trail activities such as tours, cycle sales and hire, as well as for cafes and hotels."
Senator for New South Wales Doug Cameron said the newly funded section will be moderately graded and offer the local community and visitors a safe connection through scenic areas.
"The trail will eventually go for 36 kilometres from Leura to Mt York, and to the lower mountains and Lithgow. Its moderate gradient will make it accessible and available to walkers and cyclists of all ages, including families," he said.
"This project is a good example of the real benefits of targeted, long term investment in regional communities.
"The construction of this project, and the resulting increase in tourist numbers, are expected to create an additional 250 jobs in the region."
Funding is being provided to the Blue Mountains City Council under Round Four of the Australian Government's Regional Development Australia Fund.
Stage 2 of project will be completed in the second half of next year with the total 36 kilometre regional trail to be completed by June 2019.
Tuesday, 11 June 2013
Media contacts:
Minister Albanese: Virginia Kim 0407 415 484
Senator Cameron: Mark Andrews 0417 024 890
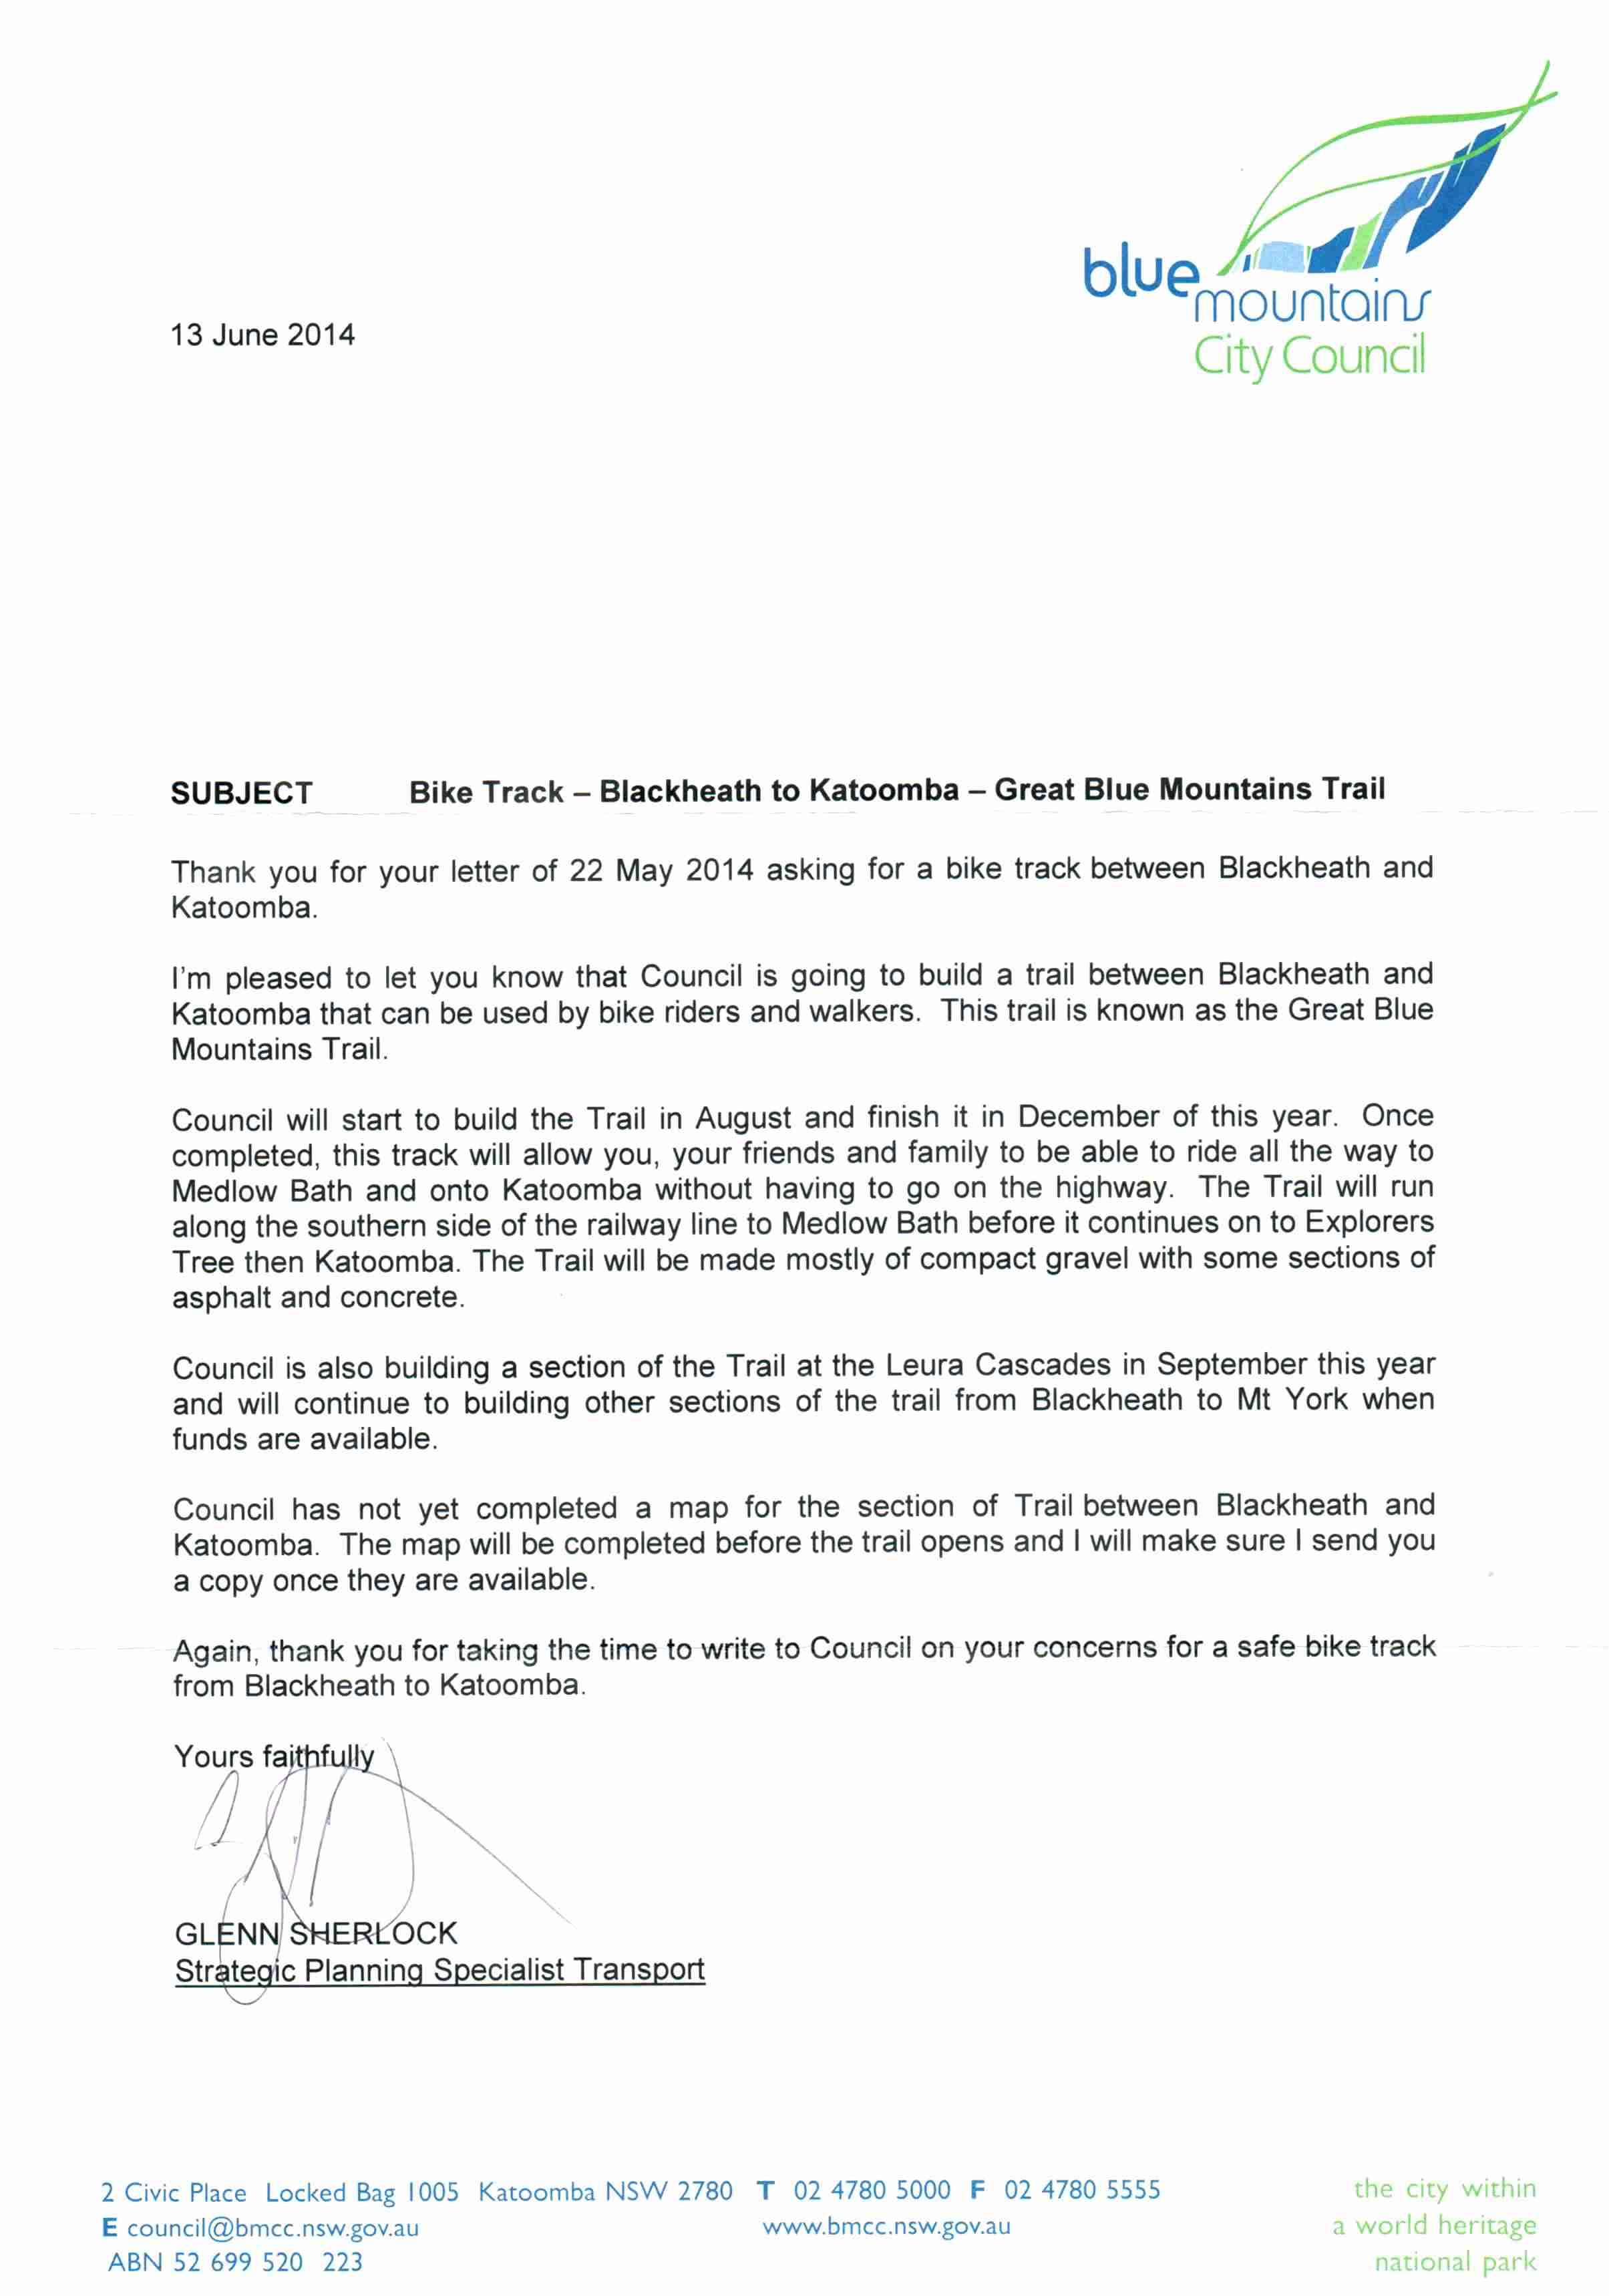
Rail Corp Minsitry for transport Roadblock August 2014
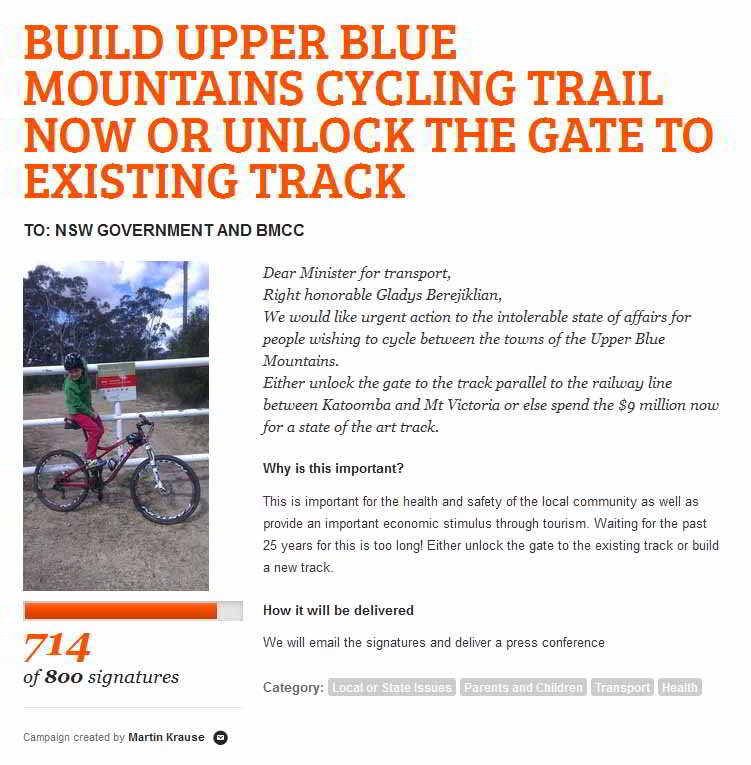
The following letter at least acknowledges a response. Strangely, it is a response from the Ministry of Transport from an email I sent to Sydney Water enquiring about the status of the track on their land between Katoomba and Medlow Bath. Fortunately, BMCC are about to construct their track on the opposite side of the highway to that of the Katoomba catchment. However, we still need cycling access to the Rail Corridor between Blackheath and Mt Victoria. Hence, the response demonstrated very little understanding of the needs of the community, nor the actual technical issues. Firstly, 2/3 of the track between Blackheath and Mt Victoria is already accessable and has been for at least 2 decades and hasn't resulted in any electrocutions, pedestrians being run over, or insurance and liability issues. The remaining closed off 1/3 is no different to the currently open 2/3. Same flimsy fence. No doubt, these issues which they have raised could be solved if there were a willingness to do so.
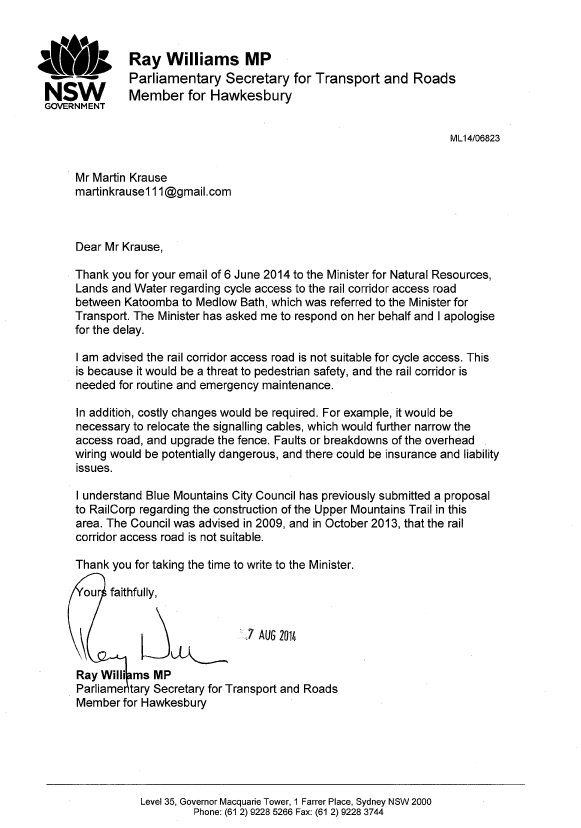
November 2015 : Rail Corp rejects BMCC's revised proposal.
BMCC and Rail Corp surveyed the Blackheath to Mt Victoria Trail beside Rail and to a lesser extent the Rail Trail. Rail Corp concluded that too many 'pinch points' existed which prohibited the co-existence of cycling and rail maintenance. This is very disappointing as the Rail Trail seems like a great option where the public is clearly being short changed from the prohibition of the use of such a beautiful public resources. BMCC made further submissions for funding for a trail beside the northern and eastern side of the GWH.
Rationale for the construction of a sealed Upper Mountains Trail
1. Introduction
The Great Blue Mountains Cycle Trail (GBMCT) is a visionary trail whereby cyclists and walkers can cross the Blue Mountains from the Sydney Basin in the East to the rural countryside west of the Great Dividing Range, traversing World Heritage listed terrain, Wollemi wilderness and eventually arriving in rural NSW. Currently, sections of this trail exist. There is a partial Rail Trail (the lower mountains Zig Zag) coming up from Emu Plains/Mitchels Pass and traversing Lapstone before making it's way into Glenbrook. Despite, the tunnel in Glenbrook being closed to cyclists and the cuttings becoming overgrown there is potential here for creating a very exciting gateway for the Great Blue Mountains Trail, with very little remediation. From Glenbrook there is the Oaks fire trail which connects with Woodford and after that, the Anderson's fire trail which links Wentworth Falls.
Unfortunately, it is from Wentworth Falls, where the problems with a discontinuous trail begin. Blue Mountains City Council (BMCC) have approved the bike plan for a segregated cycle track parallel to the Great Western Highway (GWH). In fact, they recently received funding which has allowed them to do remediation work on the track between Medlow Bath. BMCC will commence construction of the Katoomba to Medlow Bath section in September 2014 which should be completed in early 2015. Ironically, the section (Blackheath – Mt Victoria) of the rail corridor, where a track which has been open for use by climbers since the 1990's, is the most problematic, in terms of bureaucratic wrangling over cycling access to this area. If these few kilometres of rail corridor can be opened for cycling and walking, then a Trans Mountains Trail becomes reality.
The following is a case which argues for the upgrade of the construction of the Upper Blue Mountains Trail (GBMCTUM) being done by BMCC, the building of the section of trail between Blackheath and Mt Victoria along the rail corridor. These arguments are based on economic, environmental, health and safety issues using current data and comparative case presentations. Ultimately, the amelioration of the dangerous cycling conditions, in the Upper Blue Mountains, through a segregated cycling and walking trail, should make this an iconic cycle commuting, touring and rambling trail linking Sydney with NSW rural country towns like Bathurst and Mudgee.
2. Cycling participation in Australia
As a recreational pursuit, the results of the 2008 'Exercise, Recreation and Sport Survey' show that 1.93 million people cycled in 2008, representing a 21% increase in cycling participation since 2005 and a 34% increase since 2001 (DHAASC 2008). Cycling is now the 4th most popular physical activity behind walking, aerobics and swimming (DHAASC 2008). In terms of ownership, half of Australian households now own one or more bicycles, with the ACT as the state with the highest ownership at over 65% (ABS 2009). For the tenth consecutive year, bike sales exceeded motor vehicle sales in 2009 (ABC 2009). Research indicates there is a range of reasons for participating in cycling. There is a significant disparity in participation between genders. Female participation in cycling is significantly lower in Australia than many other countries – the rate of female commuter cycling is less than one third of the male rate. (Bell et al 2006). While the data shows mixed results in terms of progress over the past five years, the evidence suggests that cycling is growing in significance as a legitimate mode of transport in Australia. For example, ABC (2009) data showed a 47% increase in cycling on the top five commuter routes into capital city centres between 2005 and 2008.
Citations
• Australian Bicycle Council (2009): Annual Report
• Australian Bicycle Council data drawn from Cycling Promotion Fund (2010),
• Australian Bureau of Statistics (2009): Environmental issues: Waste Management and Transport Use, Cat. no.602.0.55.002
• Department of Health and Ageing and Australian Sports Commission (2008): Participation in Exercise, Recreation and Sport, Annual Report 2008
• Bell, C., Garrard, J. and Swinburn, B (2006) Active transport to work in Australia: is it all downhill from here?,Asia Pac. J. Publ. Health. 18 (1) pp. 62–68.
3. Demographics and Geography
The settlements in the Blue Mountains follow a narrow ridge serviced by the Great Western Highway and the Western Railway line. As such, few houses are more than a few kilometres from a Railway Station. Notably exceptions are Winmalee and the Megalong Valley. Direct train services from Cental are hourly to Katoomba, less frequent to Mt Victoria and even less so to Lithgow, where the electric train line terminates.
The region encompasses a total land area of 1,432 square kilometres, of which 74% is World Heritage National Park, renowned for its forests, rock formations, bushwalks, waterfalls and lookouts. A further 14% of the City is contained in public reserves. The City's major industry is tourism, with many holiday homes and guest accommodation in the upper mountain towns such as Blackheath, Katoomba and Wentworth Falls, while the lower mountain towns such as Blaxland, Glenbrook, Springwood and Winmalee, are more suburban in character. The main industrial estates are located in Katoomba and Lawson. The primary rural area is the Megalong Valley.
The population of the entire Council area was just under 77,000 in 2006 and is predicted to increase slightly to just over 78,500 by 2021, this represents a marginal population increase over the longer term. The residential areas that most likely to be effected by the GBMCTUM are Leura [4,343 people], Katoomba – Medlow Bath [8,708] and Blackheath and Surrounds [5,649] which represents a resident population of around 19,000 people currently that reside within close proximity to the identified route with this increasing to around 20,000 by 2021.
The Katoomba Region also has an array of inequalities compared to NSW as a whole, attributable to the regions pronounced level of socio-economic disadvantaged including:
• Katoomba has a 20 per cent greater death rate then would be expected for those less than 80 years old
• Premature death for females in Katoomba in the 25-75 age range (for all mortality causes) is 36 per cent above the rate for NSW and 42 per cent above the average for men.
• The rate of coronary heart disease experienced by males in Katoomba is 53 per cent above the rate for NSW
• Mental health suffers when social conditions are adverse. Katoomba is the only postcode in the Blue Mountains to have significantly higher rates of mental and behavioural disorders for 15-24 year-olds than the state average.
• Katoomba has the highest proportion of Blue Mountains families with children living off household incomes below $399 per week (17.6%). The state average is 13.2%.
• Despite geographical isolation and harsh winter conditions, 21.4 per cent of Katoomba households do not have a vehicle. The NSW average is 13.5 per cent.
• Single parent families comprise 15 per cent of all NSW families. Katoomba is well above this (24.3%) with more than a third of all Katoomba children (34%) living in single parent families.
• The proportion of households in Katoomba experiencing rental stress is 60.9 per cent. Rental stress is typically measured as an outlay greater than 30 per cent of total household income spent on rent.
The minimal population growth predicted in the area suggests local trail activity demand will not increase significantly as a result of local population growth and will be dependent upon visitor demand. The range of socio-economic indicators suggest the area has a relatively low socio-economic profile and given the characteristics of trail users (employed, higher income earners) it would be expected that demand for trail use from the local population would be lower compared with an equivalently sized area with a higher socio-economic status. However, this is not thought to be the case due to the local environmental sustainability focus of local residents. Furthermore, the need for the provision of low cost and alternate transport options such as cycling and walking trails is also higher in this area due to the high level of health issues, relatively low socio-economic status and lower levels of car ownership (Treadwell 2010).
Citations
• Treadwell (2010) Blue Mountains City Council Great Blue Mountains Trail: Upper Mountains Component : Feasibility Assessment Final Report.
4. Gundangurra Tribe
The world-famous Three Sisters landmark at Echo Point, Katoomba, is officially the 98th place in NSW to be declared of cultural, social and historic significance to the Aboriginal community.
The area down into the valley below the Three Sisters has traditionally been used as a ceremonial space with legend telling how the Three Sisters came to be the land formations they are today. The area is highly valued by the Aboriginal peoples of the Gundangurra, Wiradjuri, Tharawal and Darug nations.
Elders of the Gundangurra Tribe, the traditional custodians of the land over which the trail will run, have given their support to this proposal. Indeed, the trail should be named by the indigenous people of the Blue Mountains and signage should be made, describing significant Aboriginal history in the form of a 'discovery trail' of pre-European history and culture. Both, the Andersons and Oaks fire trails, which would form part of the Trans Mountains Trail, have significant Aboriginal caves with engravings and axe grinding grooves, which are already being managed by NPWS. The Cliff Drive section of the GBMCTUM also goes past 'the Gully'; important for recent Aboriginal history, where a vibrant community of Europeans and Aborigines co-existed until the 1950's.
5. Active Transport
In most communities, 20-40% of the population cannot or should not drive due to disabilities, low incomes, or age. In addition, many trips, such as short errands, are most efficiently made by active modes. There is evidence of significant latent demand for active travel; many people want to walk and bicycle more than they currently do but face obstacles (ABW 2010). Active transport facility improvements often lead to more walking and cycling activity (FHWA 2012; Litman 2009b; Living Streets 2011). Similarly, there appears to be significant latent demand for housing in walkable communities (Leinberger 2012). Current demographic and economic trends (aging population, rising fuel prices, urbanization, growing traffic congestion, and increased health and environmental concerns) are increasing demand for active transport and the potential benefits from accommodating this demand (Litman 2006).
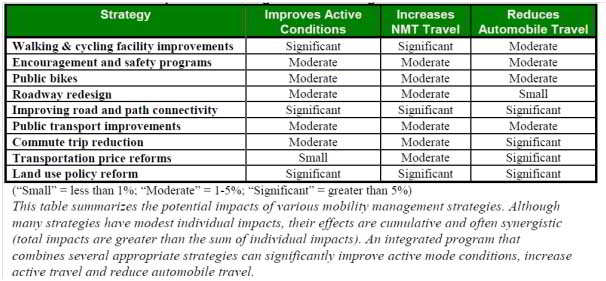
Travel impacts which encourage active transport
Citations
• ABW (2010 and 2012), Bicycling and Walking in the U.S.: Benchmarking Reports, Alliance for Biking & Walking (www.peoplepoweredmovement.org); at www.peoplepoweredmovement.org/benchmarking.
• FHWA (2012), Complete Streets (www.completestreets.org), provides information on multi-modal road planning. FHWA Bicycle and Pedestrian Program Office (www.fhwa.dot.gov/environment/bikeped) promotes bicycle and pedestrian accessibility, use and safety.
• Litman (2006), The Future Isn't What It Used To Be: Changing Trends And Their Implications For Transport Planning, Victoria Transport Policy Institute (www.vtpi.org); at www.vtpi.org/future.pdf; originally published as "Changing Travel Demand: Implications for Transport Planning," ITE Journal, Vol. 76, No. 9, (www.ite.org), September, pp. 27-33.
• Litman (2009), Where We Want To Be: Home Location Preferences And Their Implications For Smart Growth, Victoria Transport Policy Institute (www.vtpi.org); at www.vtpi.org/sgcp.pdf.
• Litman (2011), "Adjusting Data Collection Methods: Making the Case for Policy Changes to Build Healthy Communities," From Inspiration to Action: Implementing Projects to Support Active Living, American Association for Retired Persons (www.aarp.org) and Walkable and Livable Communities Institute (www.walklive.org), pp. 104-107; at www.walklive.org/project/implementation-guide.
6. GBMCTUM as an essential link
Transport systems tend to have network effects: their impacts and benefits increase as they expand. For example, a single sidewalk or bicycle lane generally provides little benefit since it will connect few destinations, but a network of sidewalks and bicycle lanes that connect most destinations in an area can be very beneficial. Similarly, a single sidewalk or bicycle path that connects two networks (i.e., it fills a missing link) can provide very large benefits.
Transportation improvement strategies also have synergistic effects, that is, their total impacts are greater than the sum of their individual impacts. The first few sidewalks, bike lanes or encouragement programs in a community will seldom offer a high economic return if evaluated individually, although once completed the network may provide very large benefits. It is therefore important to use comprehensive and systematic evaluation of active mode benefits.
The GBMCTUM represents the essential link between the cycling networks of the Sydney Basin and cycle touring possibilities west of the divide. For example, there appears to be little demand for the lower mountains Zig Zag connecting the Sydney Basin with the lower Blue Mountains. However, if this was also the connection with the entire Blue Mountains, including the Oaks and Andersons fire trails, the Wolgan Valley Rail Trail, with Lithgow and Bathurst, then we are looking at an international cycle touring icon such as "Bathurst to the Sea". Furthermore, the same trail project can also be seen in the light of a "Manly to Mudgee" 300km cycle trail, where the Sydney Basin cycle network is connected to Mudgee through the construction of 25km of GBMCTUM, upgrading 15km of the Wolgan Valley Rail Trail, signage through Cullen Bullen State Forest, and connecting with the yet-to-be-built Kandos to Mudgee Rail Trail, via the Glen Alice road. Hereby, you've connected communities physically and economically throughout this network. Moreover, a 300km network with a minimal investment in small connectors between pre-existing paths and trails can be made. Such an analysis must be of particular interest to Destinations NSW.
7. GBMCTUM rather than cycling on the 'unsafe' Great Western Highway.
The Great Western Highway between Katoomba and Mt Victoria represents a major national highway with large volumes of trucks and cars using one of only two crossings of the Blue Mountains. Currently, the highway is single lane with no shoulder. The high speed and large volumes of traffic (the annual average daily traffic (AADT) data for 2005, recorded 16,657 vehicle movements east of Narrow Neck Road and 16,368 vehicle movements south of Govetts Leap Road: RMS 2014) and limited space on the road make it a very dangerous proposition when considering its use by cyclists. The highway has been progressively upgraded over the past 3 decades. However, presently there are only limited plans for the upgrading of the highway along the stretch in the Upper Blue Mountains. Hence, the residents of the Upper Mountains are completely disconnected by any means of active transport. Furthermore, limited train and bus services make this disconnectedness even more acute.
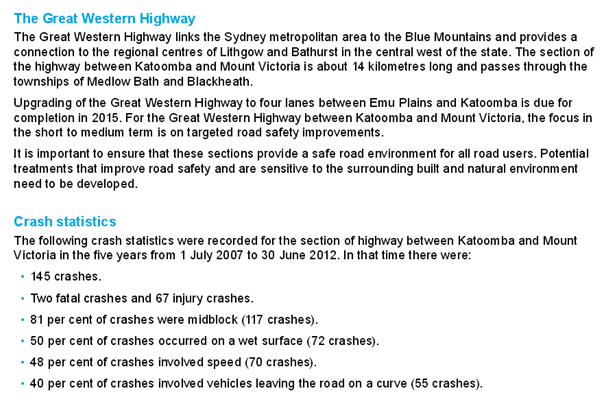
Cycling Rates are low, crash rates are relatively high and under-reported.
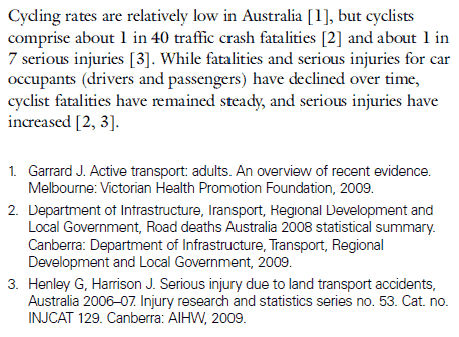
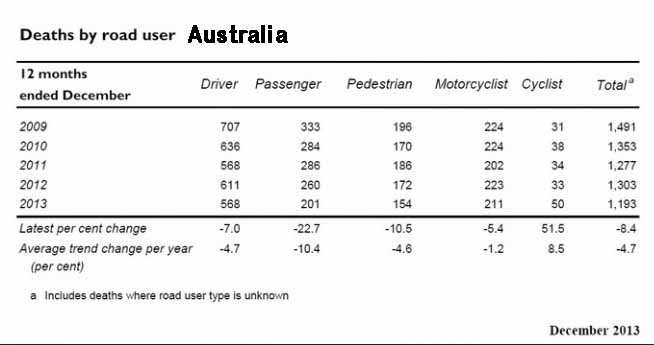
In Australia, transport-related deaths fell from 1,524 in 2008 to 1,477 in 2009. The majority of deaths (72% in 2009) were associated with motor vehicles driven on public roads. Pedestrian deaths fell from 206 in 2008 to 194 in 2009, while the number of pedal cyclist deaths increased from 26 to 35 (ABS 1301.0 - Year Book Australia, 2012). Cyclists are among the most vulnerable of road users. They have the highest proportion of self-reported near-miss crashes, which is significantly higher than that of motorists. The average probability of a cyclist being seriously injured in a collision was almost 27% - that's more than 1 in 4 crashes resulting in a serious injury (Wood et al 2009). In 2008, the majority of cyclist fatalities occurred on Sunday (21) and Friday (18), and 12-6pm was the most dangerous time for cyclist fatalities (CARRS 2011). The relative risk of injury on a bicycle is around 13-19 times higher than in a car over the four-year period (2002-5), which is broadly comparable to the results from Melbourne based on CrashStats data. It also appears that fatality risk may be greater for cyclists in Sydney, with more cyclists killed despite cycling rates of around half those of Melbourne (Garrard et al 2010). The cyclist fatality rate of between 4 and 7 per 10 to power of 8km in Sydney is several times greater than in the Netherlands (1.1 per 10 to power of 8km), Denmark (1.5) and Germany (1.7), though comparable to the USA (5.8) [Pucher J 2008]. The cyclist serious injury rate in Melbourne of between 124 (police data) and 315 (hospital data) per 10 to power of 8km cycled is very much greater than in the Netherlands (14), Denmark (17) and Germany (47), though, once again, comparable to the USA (375) [Pucher et al 2008]. A recent analysis reported a killed or seriously injured cyclist casualty rate of 54 per 10 power of 8km in Britain in 2008 based on police crash reports [Knowles J et al 2009].
Marshall and Garrick (2011) found that U.S. cities with higher per capita bicycling rates tend to have much lower traffic fatality rates, for all road users, than other cities. They conclude that this results, in part, because increased street network density both supports cycling and reduces traffic speeds and therefore risk. Robinson (2005), Geyer, Raford and Ragland (2006), and Turner, Roozenburg and Francis (2006) also find that shifts from driving to active modes by sober, responsible adults are unlikely to increase total accidents, and that per capita collisions between motorists, pedestrians and cyclists decline as active transport activity increases.
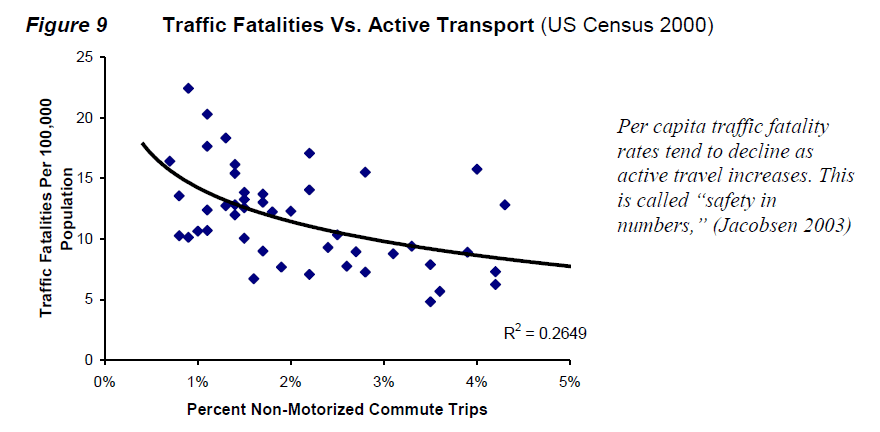
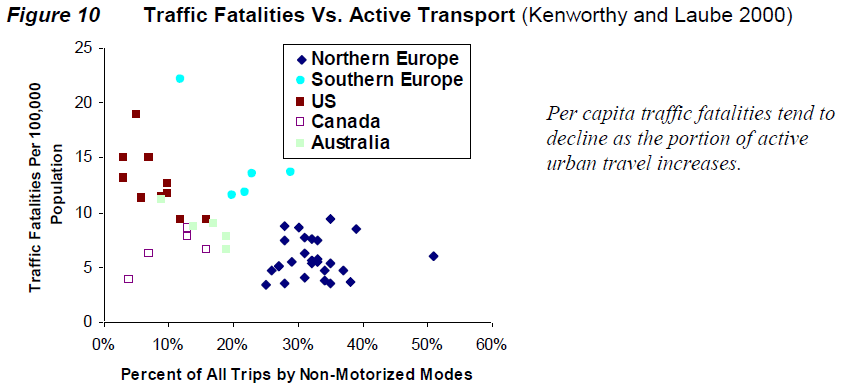
Various studies indicate that automobile external accident costs average 2¢ to 12¢ per vehicle-mile, depending on driver and travel conditions, and the scope of costs considered ("Crash Costs," Litman 2009; van Essen, et al. 2007; TC 2008). Net safety benefits provided by automobile to active travel shifts are estimated to average 5¢ per urban peak mile, 4¢ per urban off-peak mile, and 3¢ per rural mile, with greater benefits from strategies that reduce walking and cycling risk, for example if active travel increases due to more separated facilities (e.g., sidewalks and paths), traffic speed reductions, improved traffic law enforcement and cycling education.
The statistics into cycling injuries in the Upper Blue Mountains are more difficult to find. However, as speed is purported to be a major factor in cycling injury and even death, then it would well be worth hypothesising the risk to a cyclist if they were fool hardy enough to use the GWH where the speed zones are up to 80km/hr.
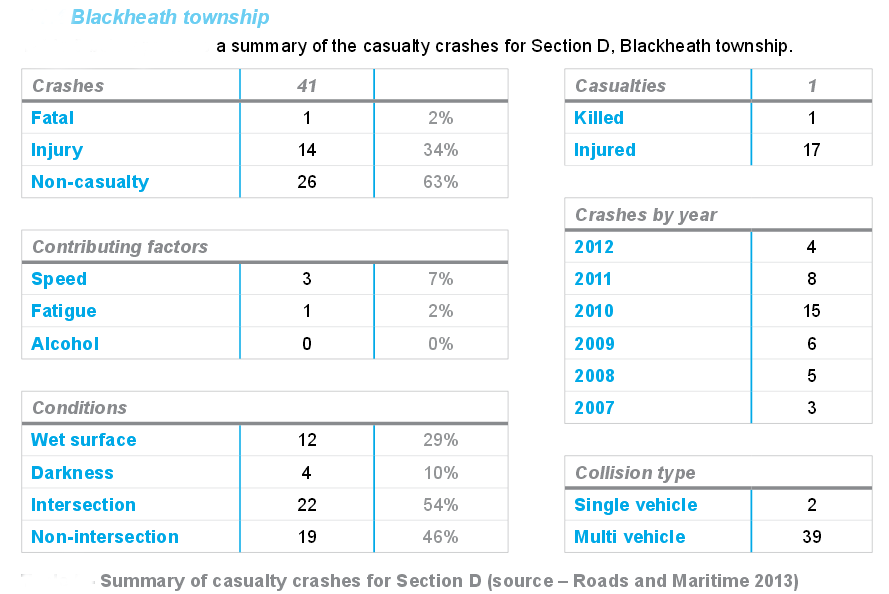
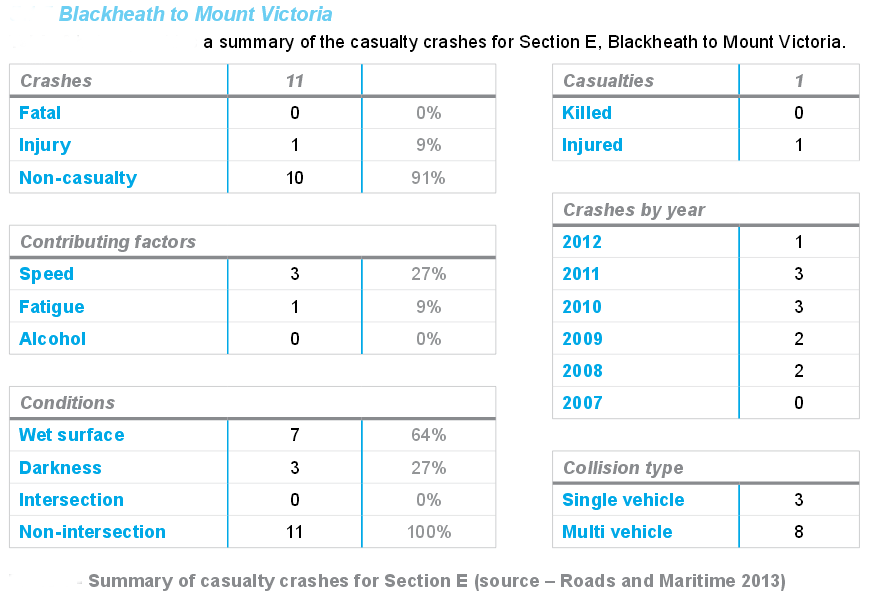
Source : RMS 2014
Interestingly, similar to the sections between Katoomba and Blackheath, speed was the major cause of crashes, both in the township as well as between towns. In the section of highway between Blackheath and Mt Victoria, it is expected that cyclists share the road with vehicles moving at 80km/hr. Apart from the lack of cyclists on this stretch of road due to its inherent danger, all the crash statistics involving cyclists are likely to be under-reported due to the inclusions criteria used (see below).
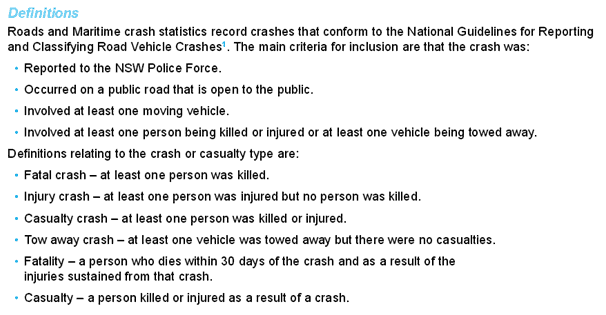
It should be noted that not all bicycle accidents involve car collisions, which may also contribute to under reporting of cycling accidents, as found by Richardson DB (2009). While road safety counter-measures have undoubtedly led to a safer operating environment for vehicle occupants, the (arguably) car-centric nature of many of these measures has in fact done little to improve cyclist safety. Cyclists appear to be over-represented in terms of fatalities and serious injuries relative to their exposure to traffic, but under-represented in interventions aimed at reducing traffic fatalities and injuries (Garrard et al 2010).
Trails beside Rail:
In the USA, there are more than 21,000 miles of rail-trails across the country, in urban, suburban, and rural areas. But these trails don't need to be built on the graves of defunct rail lines. A growing number of them, in fact, are constructed next to active rail lines. In 1996, there were slightly less than 300 miles of these trails. Today there are about 1,400 miles. Railroads tend to be skittish about approving walking and biking routes because they fear liability if someone gets injured. Even so, 43 percent of rails-with-trails, as they're known, are located wholly within railroad rights-of-way, while another 12 percent have some segments inside the right-of-way.
By planning for mobility along and even across railroad tracks, railroads can help prevent some of the 430 fatalities that occur each year when people cross tracks where they shouldn't. In its comprehensive study of rails-with-trails, the Rails-to-Trails Conservancy found only one record of a fatality (and two injuries) on such facilities in 20 years:
This suggests that providing a well-designed pathway dedicated for cyclists and pedestrians provides a safe travel alternative and reduces the incentive to trespass or use the tracks as a shortcut. Such pathways often include some form of barrier between the trail and the active railway, and carefully-planned intersections if the trail crosses the tracks.
http://usa.streetsblog.org/2014/08/18/why-it-makes-sense-to-add-biking-and-walking-routes-along-active-rail-lines/
Garrard et al (2010) concluded the following :
International experience demonstrates that cycling safety can be improved markedly using the same sort of strategic planning that has been used to improve safety for car occupants [6]. Improved cycling conditions that are likely to contribute to increased cycling safety include:
• more extensive, high quality and well-maintained cycling infrastructure, including separated cycling facilities
• basing priority systems on needs of vulnerable road users (where appropriate), rather than car occupants
• improved interactions between cyclists and drivers in the form of mutual respect, courtesy and willingness to share public road space
• education and training for drivers and cyclists aimed at improving skills, attitudes and behaviours
• urban speed limits based on human tolerance to injury in collision with a motor vehicle
• placing greater responsibility for traffic safety through the legal system on those road users who have the potential to cause the most harm to others.
Hence, we are calling for the construction of a segregated cycle path similar to the one built along the M7, using rail corridors (Blackheath - Mt Victoria), existing unsealed roads as well as the 'upgrading' of the 'adventure trail' track which is about to be built (commencing September 2014) by BMCC.
Trail beside Rail or a Rail Trail : Blackheath - Mt Victoria
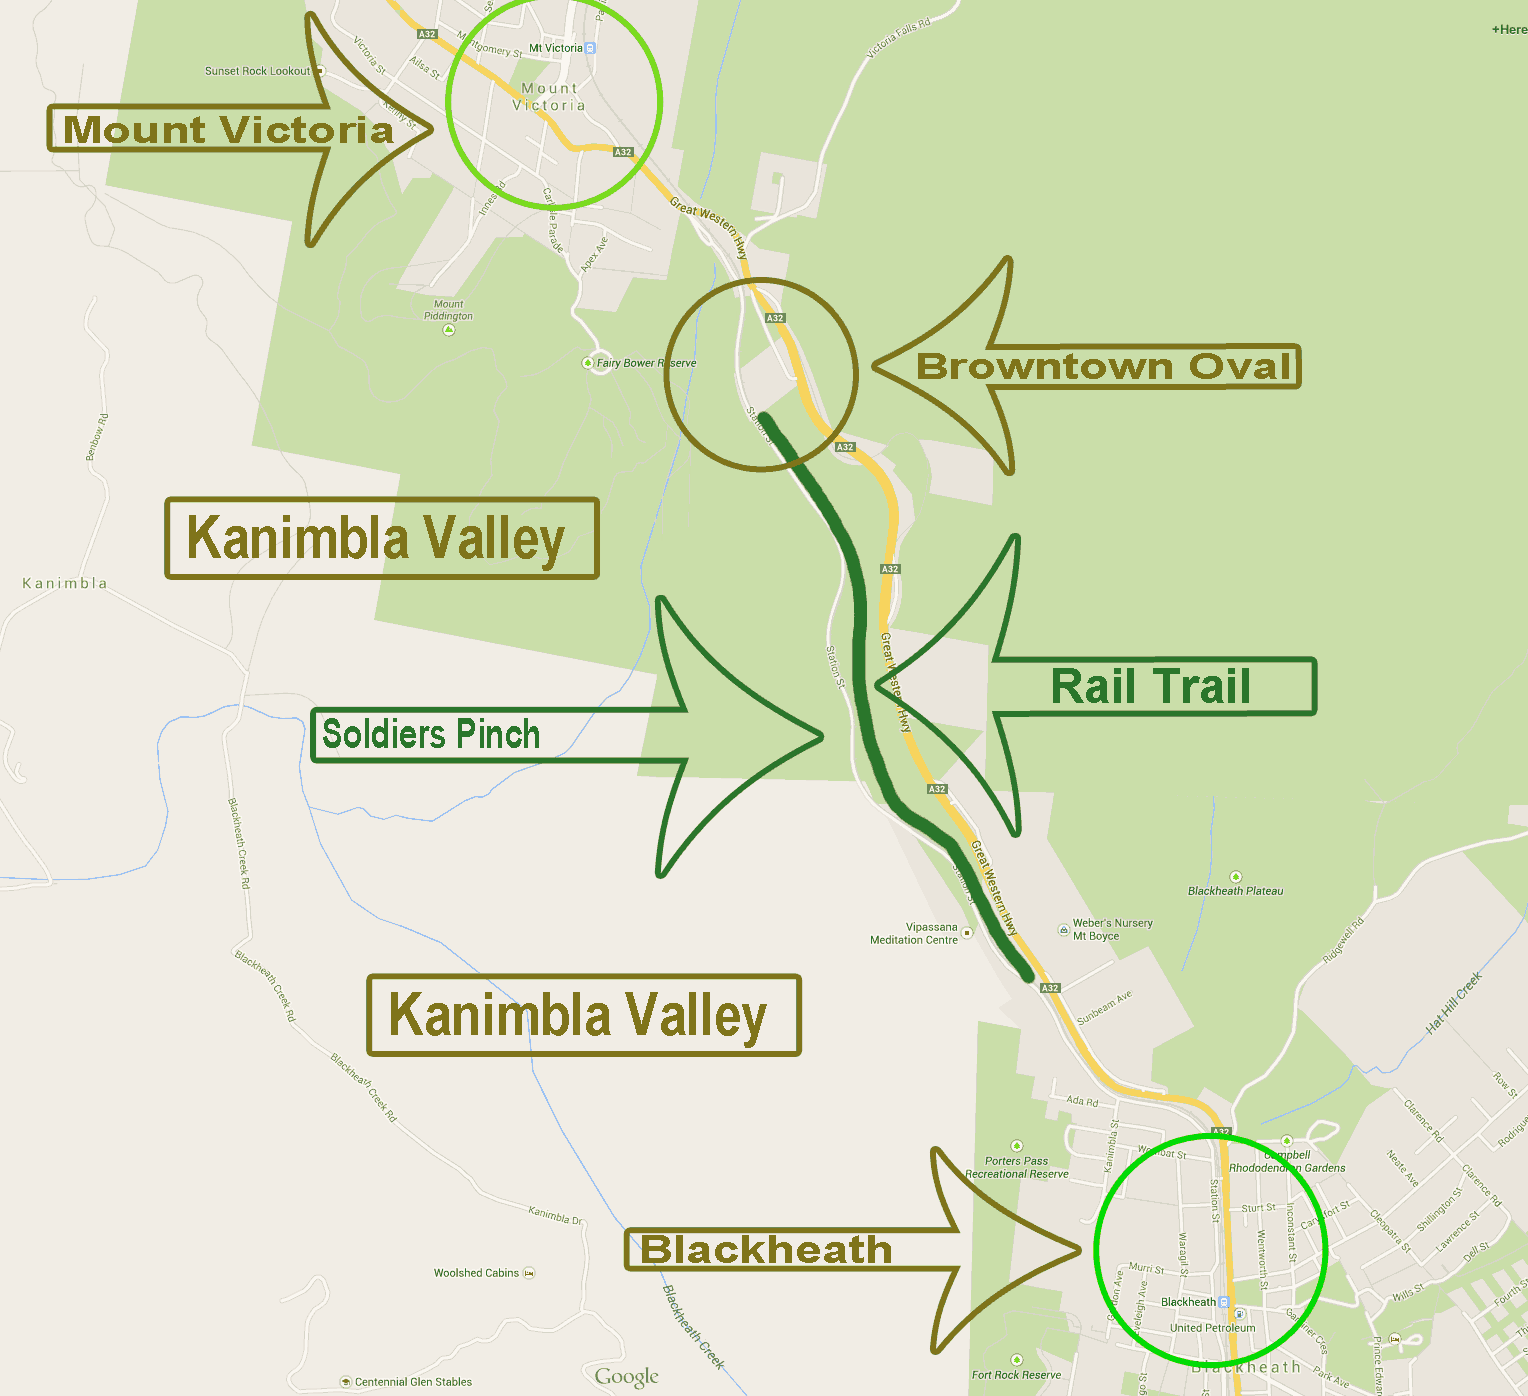
There appears to be two distinct possibilities for the trail westward of Blackheath. Either, using the Trail beside Rail on the south western sde of the Railway Line or a Rail Trail on the north eastern side of the line. The latter is completely separated from the Railway Line but still falls within the rail corridor. It would connect Brown Town Oval with Blackheath. It would need access pathways at Blackheath township, which become part of the highway upgrade. Similarly, the Rail Trail needs to cross the railway line at the same location as the GWH does at Mt Victoria and hence the bridge there would need pedestrian/cyclist path widening or an electric boom gate could be installed at Railway line level near Fairy Bower reserve.
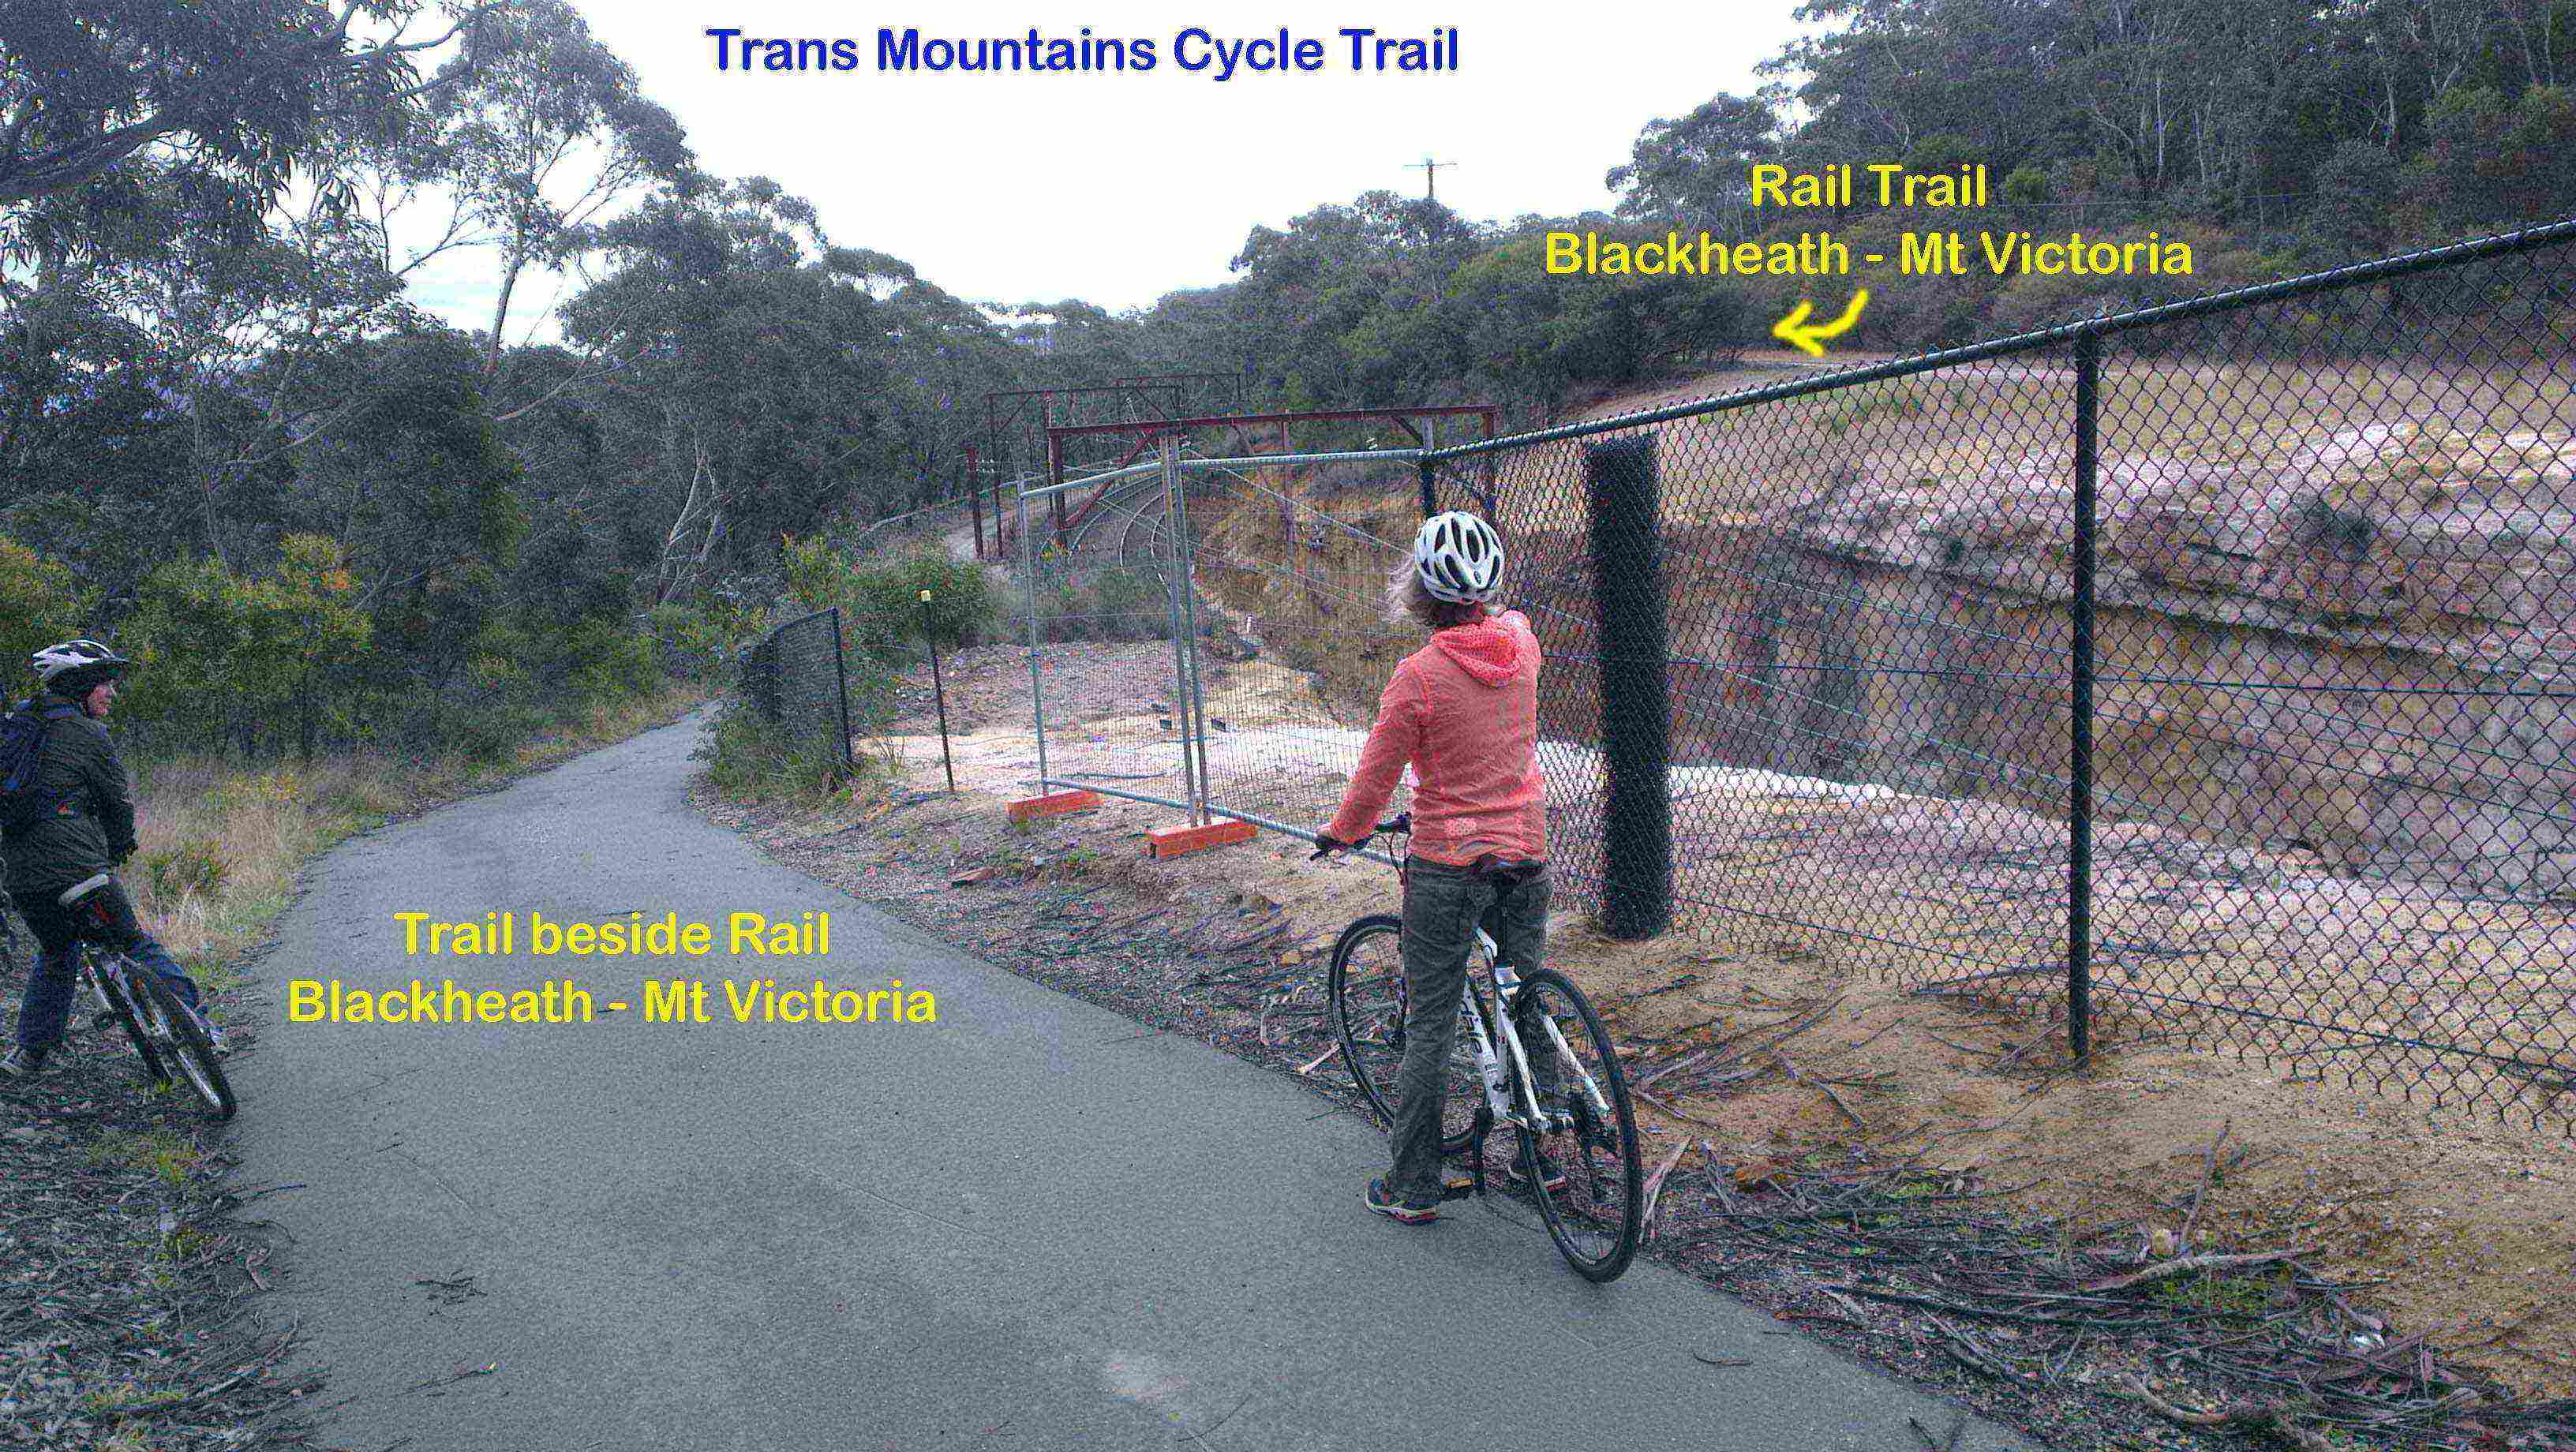
Two ways or create a round trip? Looking west at the Vapassana meditation centre
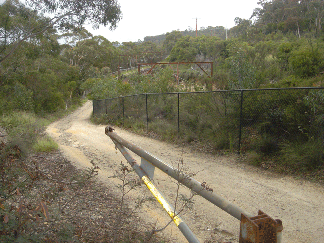
Trail beside Rail between Blackheath end and Mt Victoria
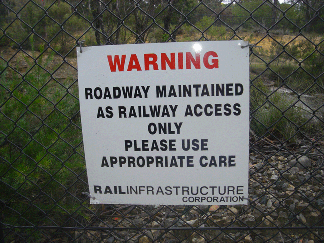
Liability issues negated
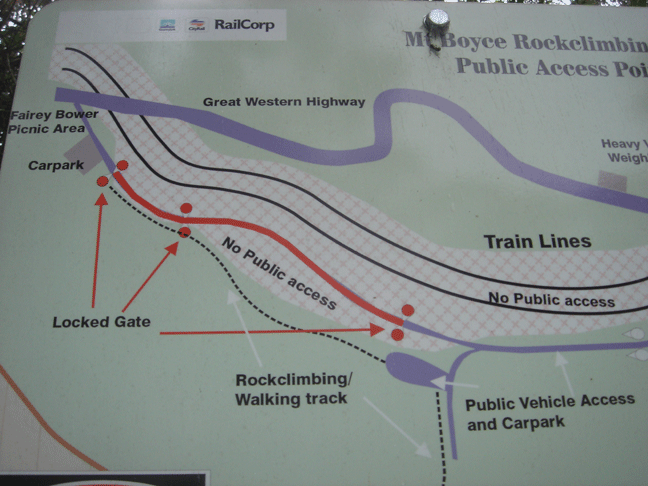
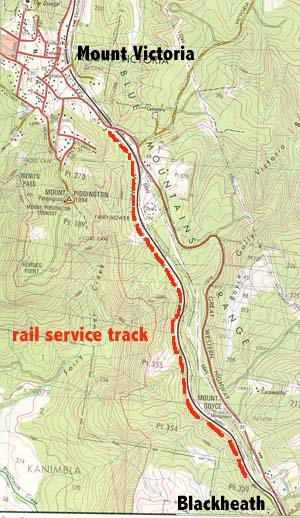
Map describing permited access to the Trail beside Rail
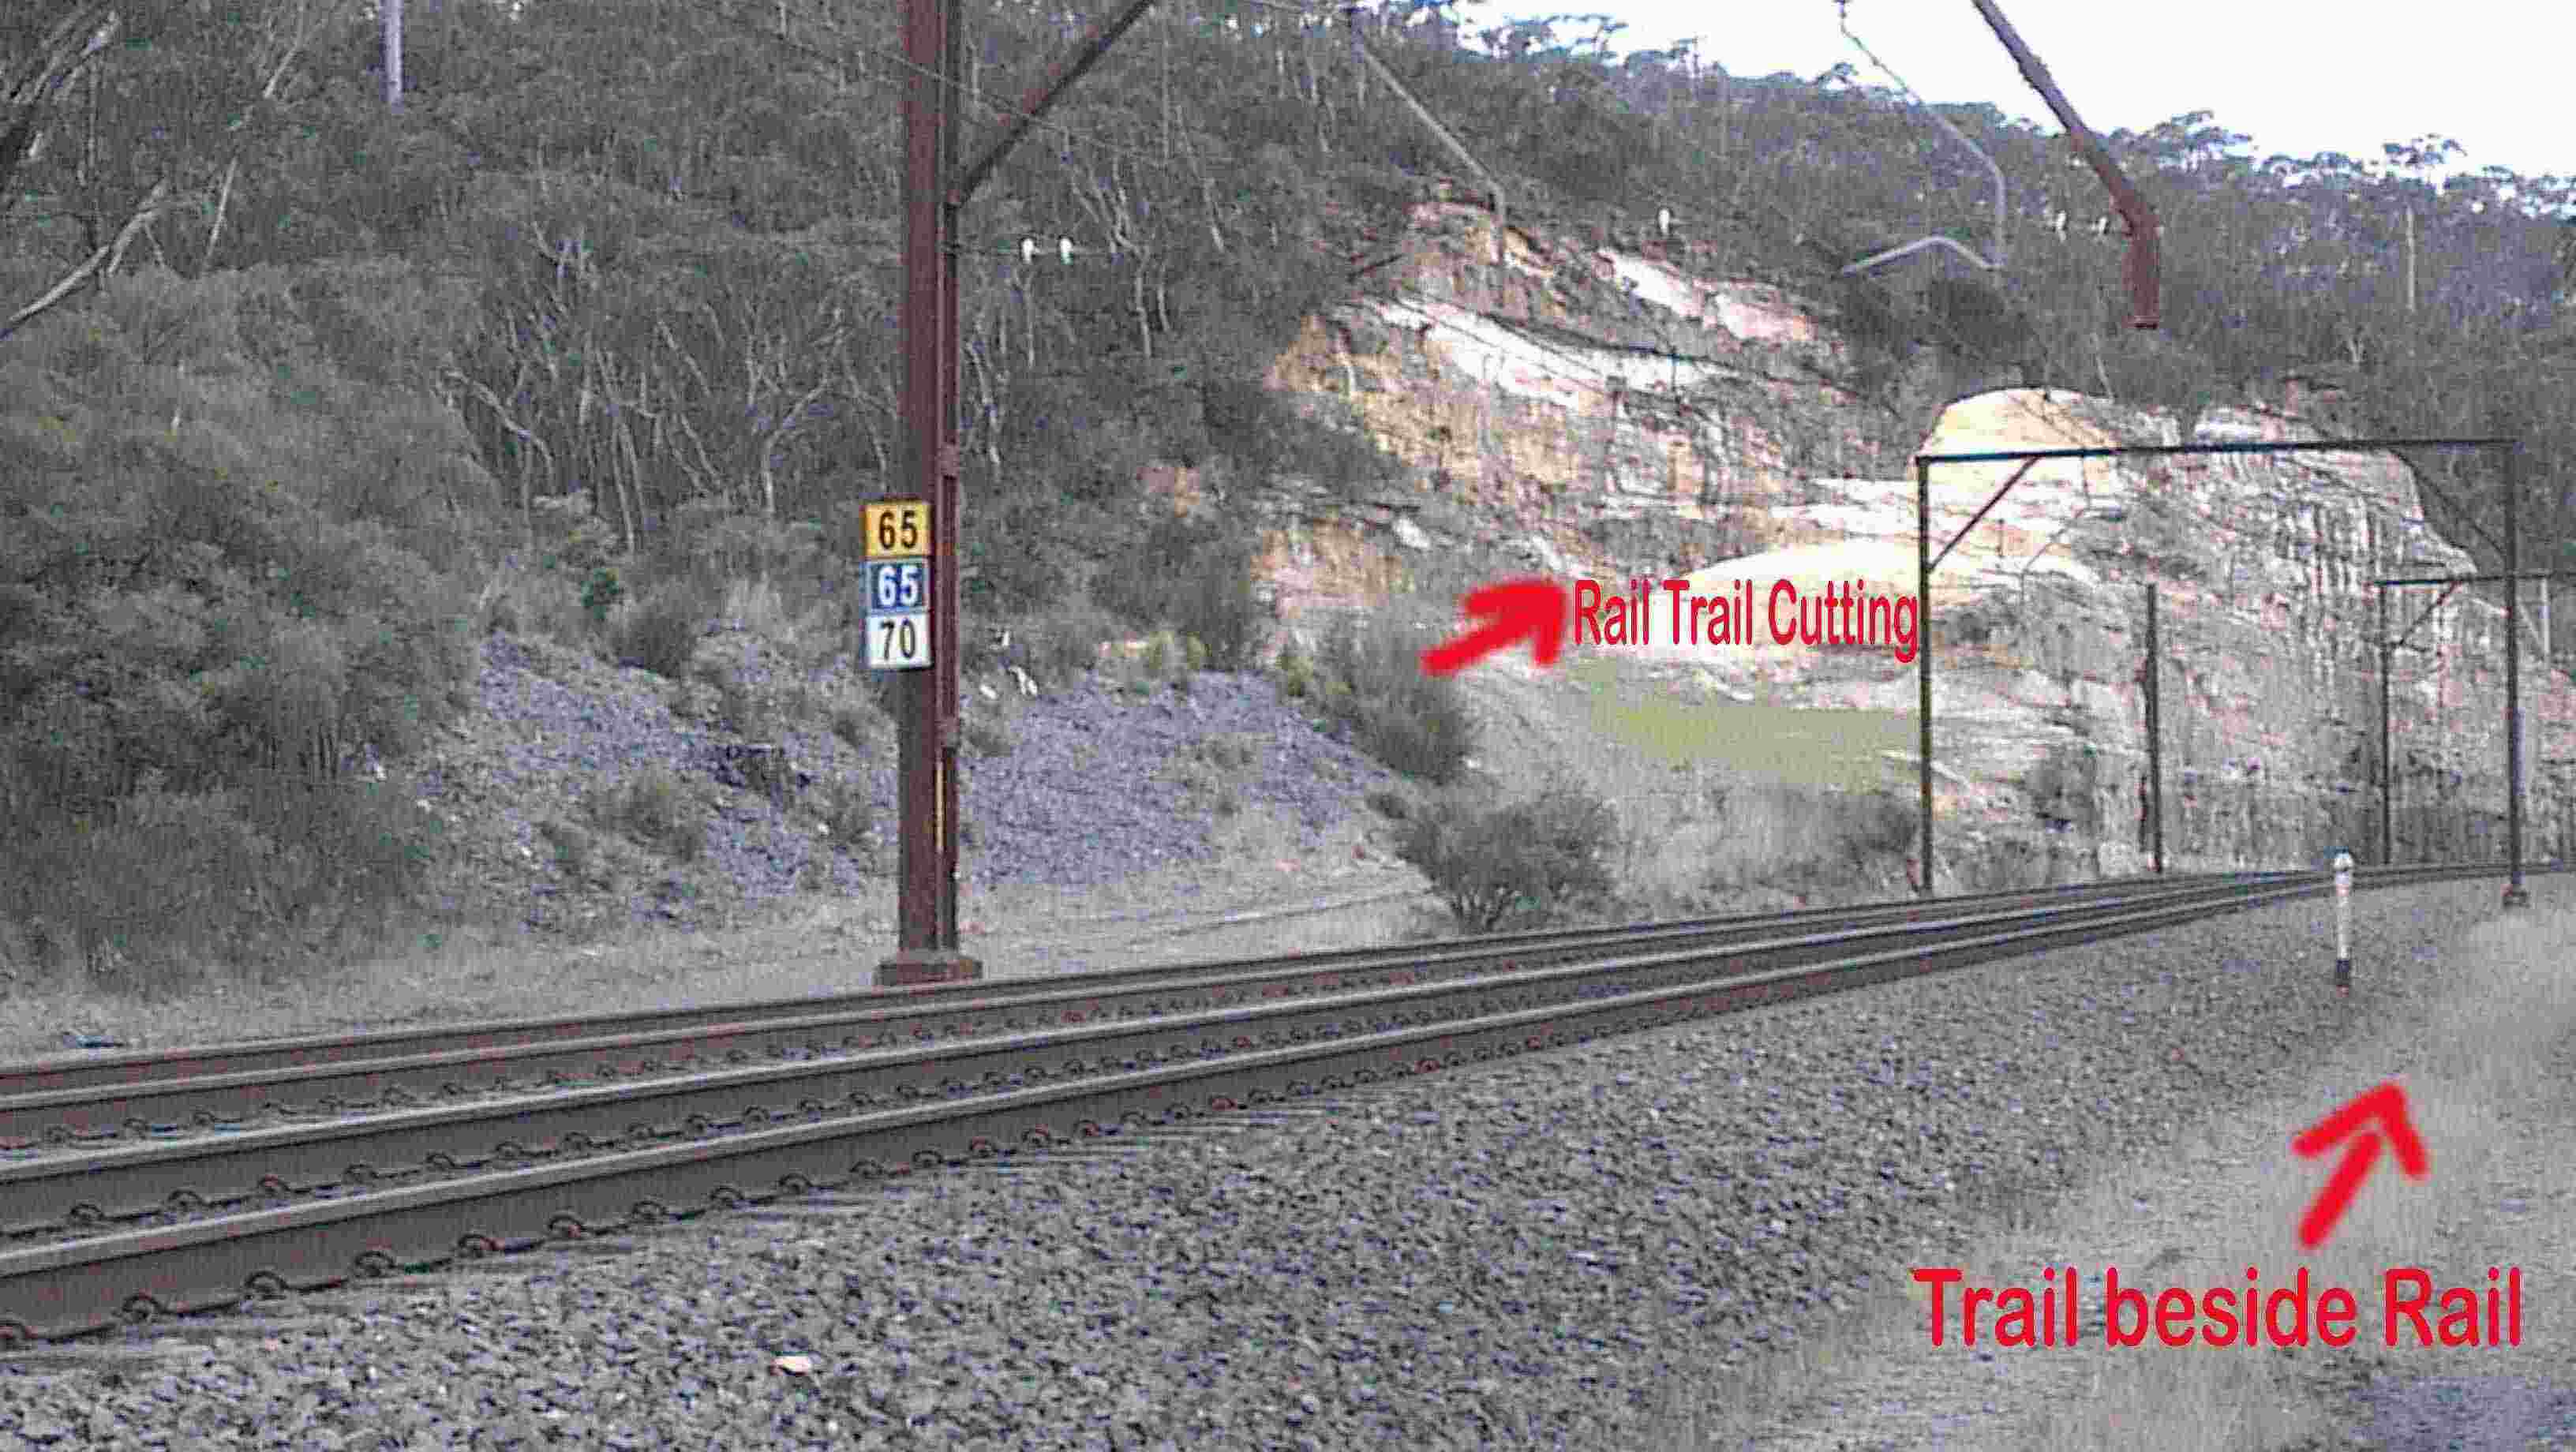
Two possibilities - a Rail Trail to the left (north east) of the tracks separated from trains or the Trail beside Rail on the right (south west) side of the tracks (this picture is looking east)
An historical 3.6km of Rail Trail along the disused original railway easement - currently hidden by Rail Corp.
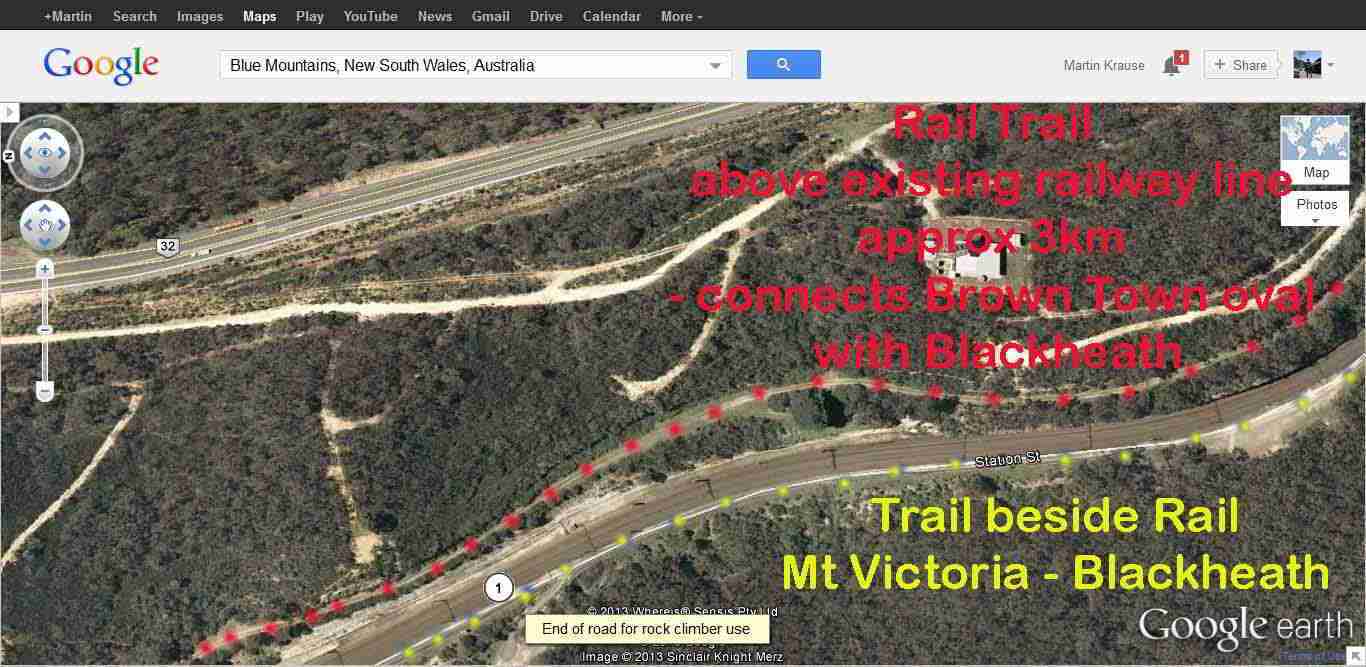
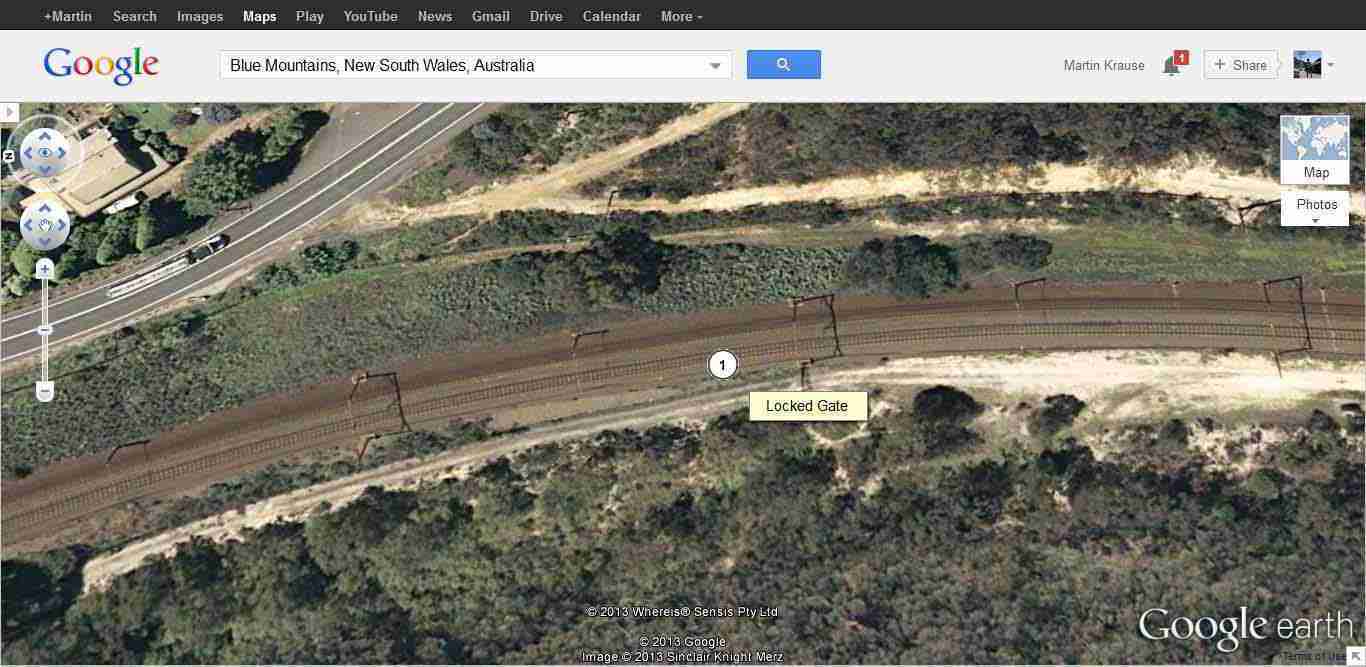
Highway near Mt Victoria and Brown Town Oval with locked gate on the trail beside rail (1) and on the opposite side the commencement of the Rail Trail
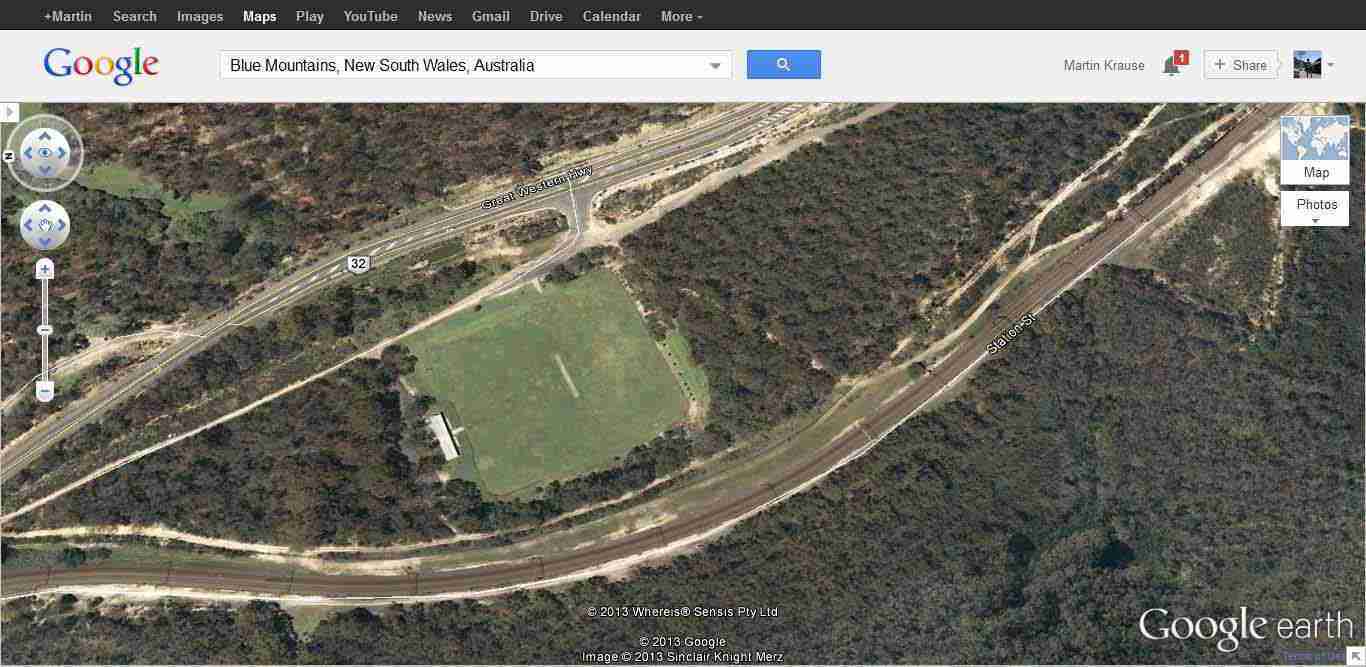
Brown Town Oval - Rail Trail on same side as oval; Trail beside Rail on opposite side of the tracks
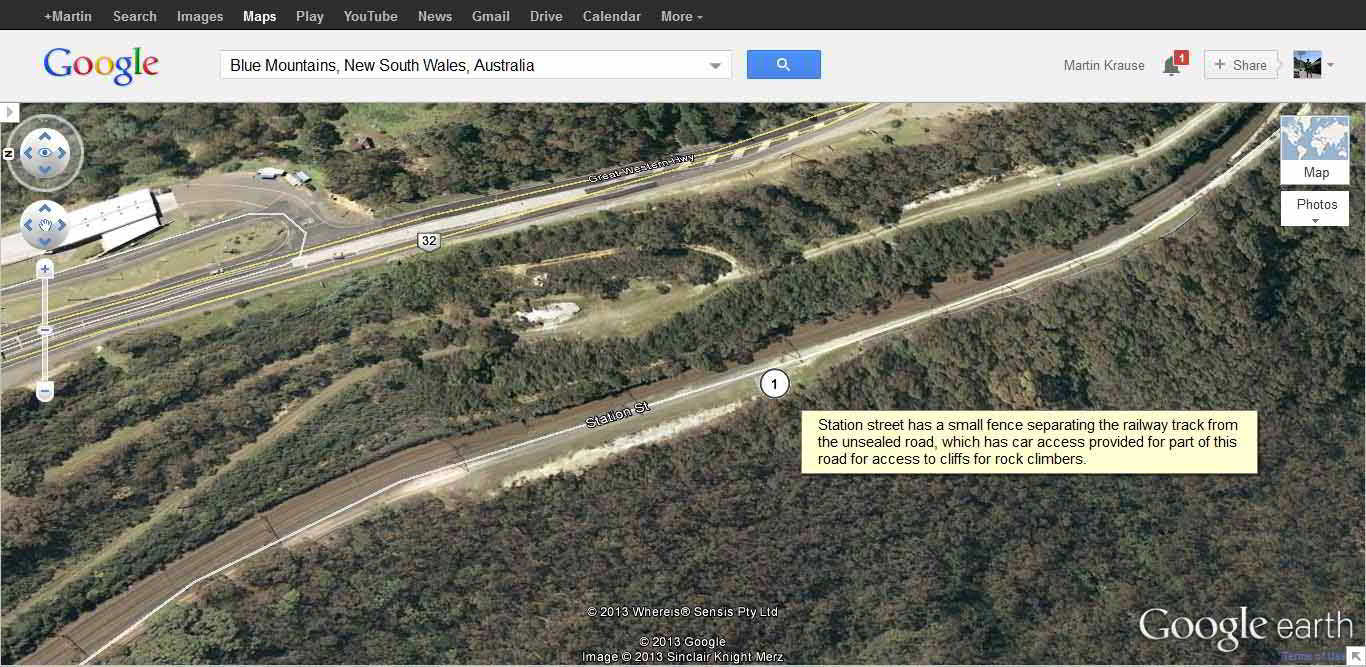
A small section of tracks at Mt Boyce where the Rail Trail (between the tracks and highway) and the Trail beside Rail (1) can quite clearly be seen
existing 900m of unfenced locked off area of Trail beside Rail
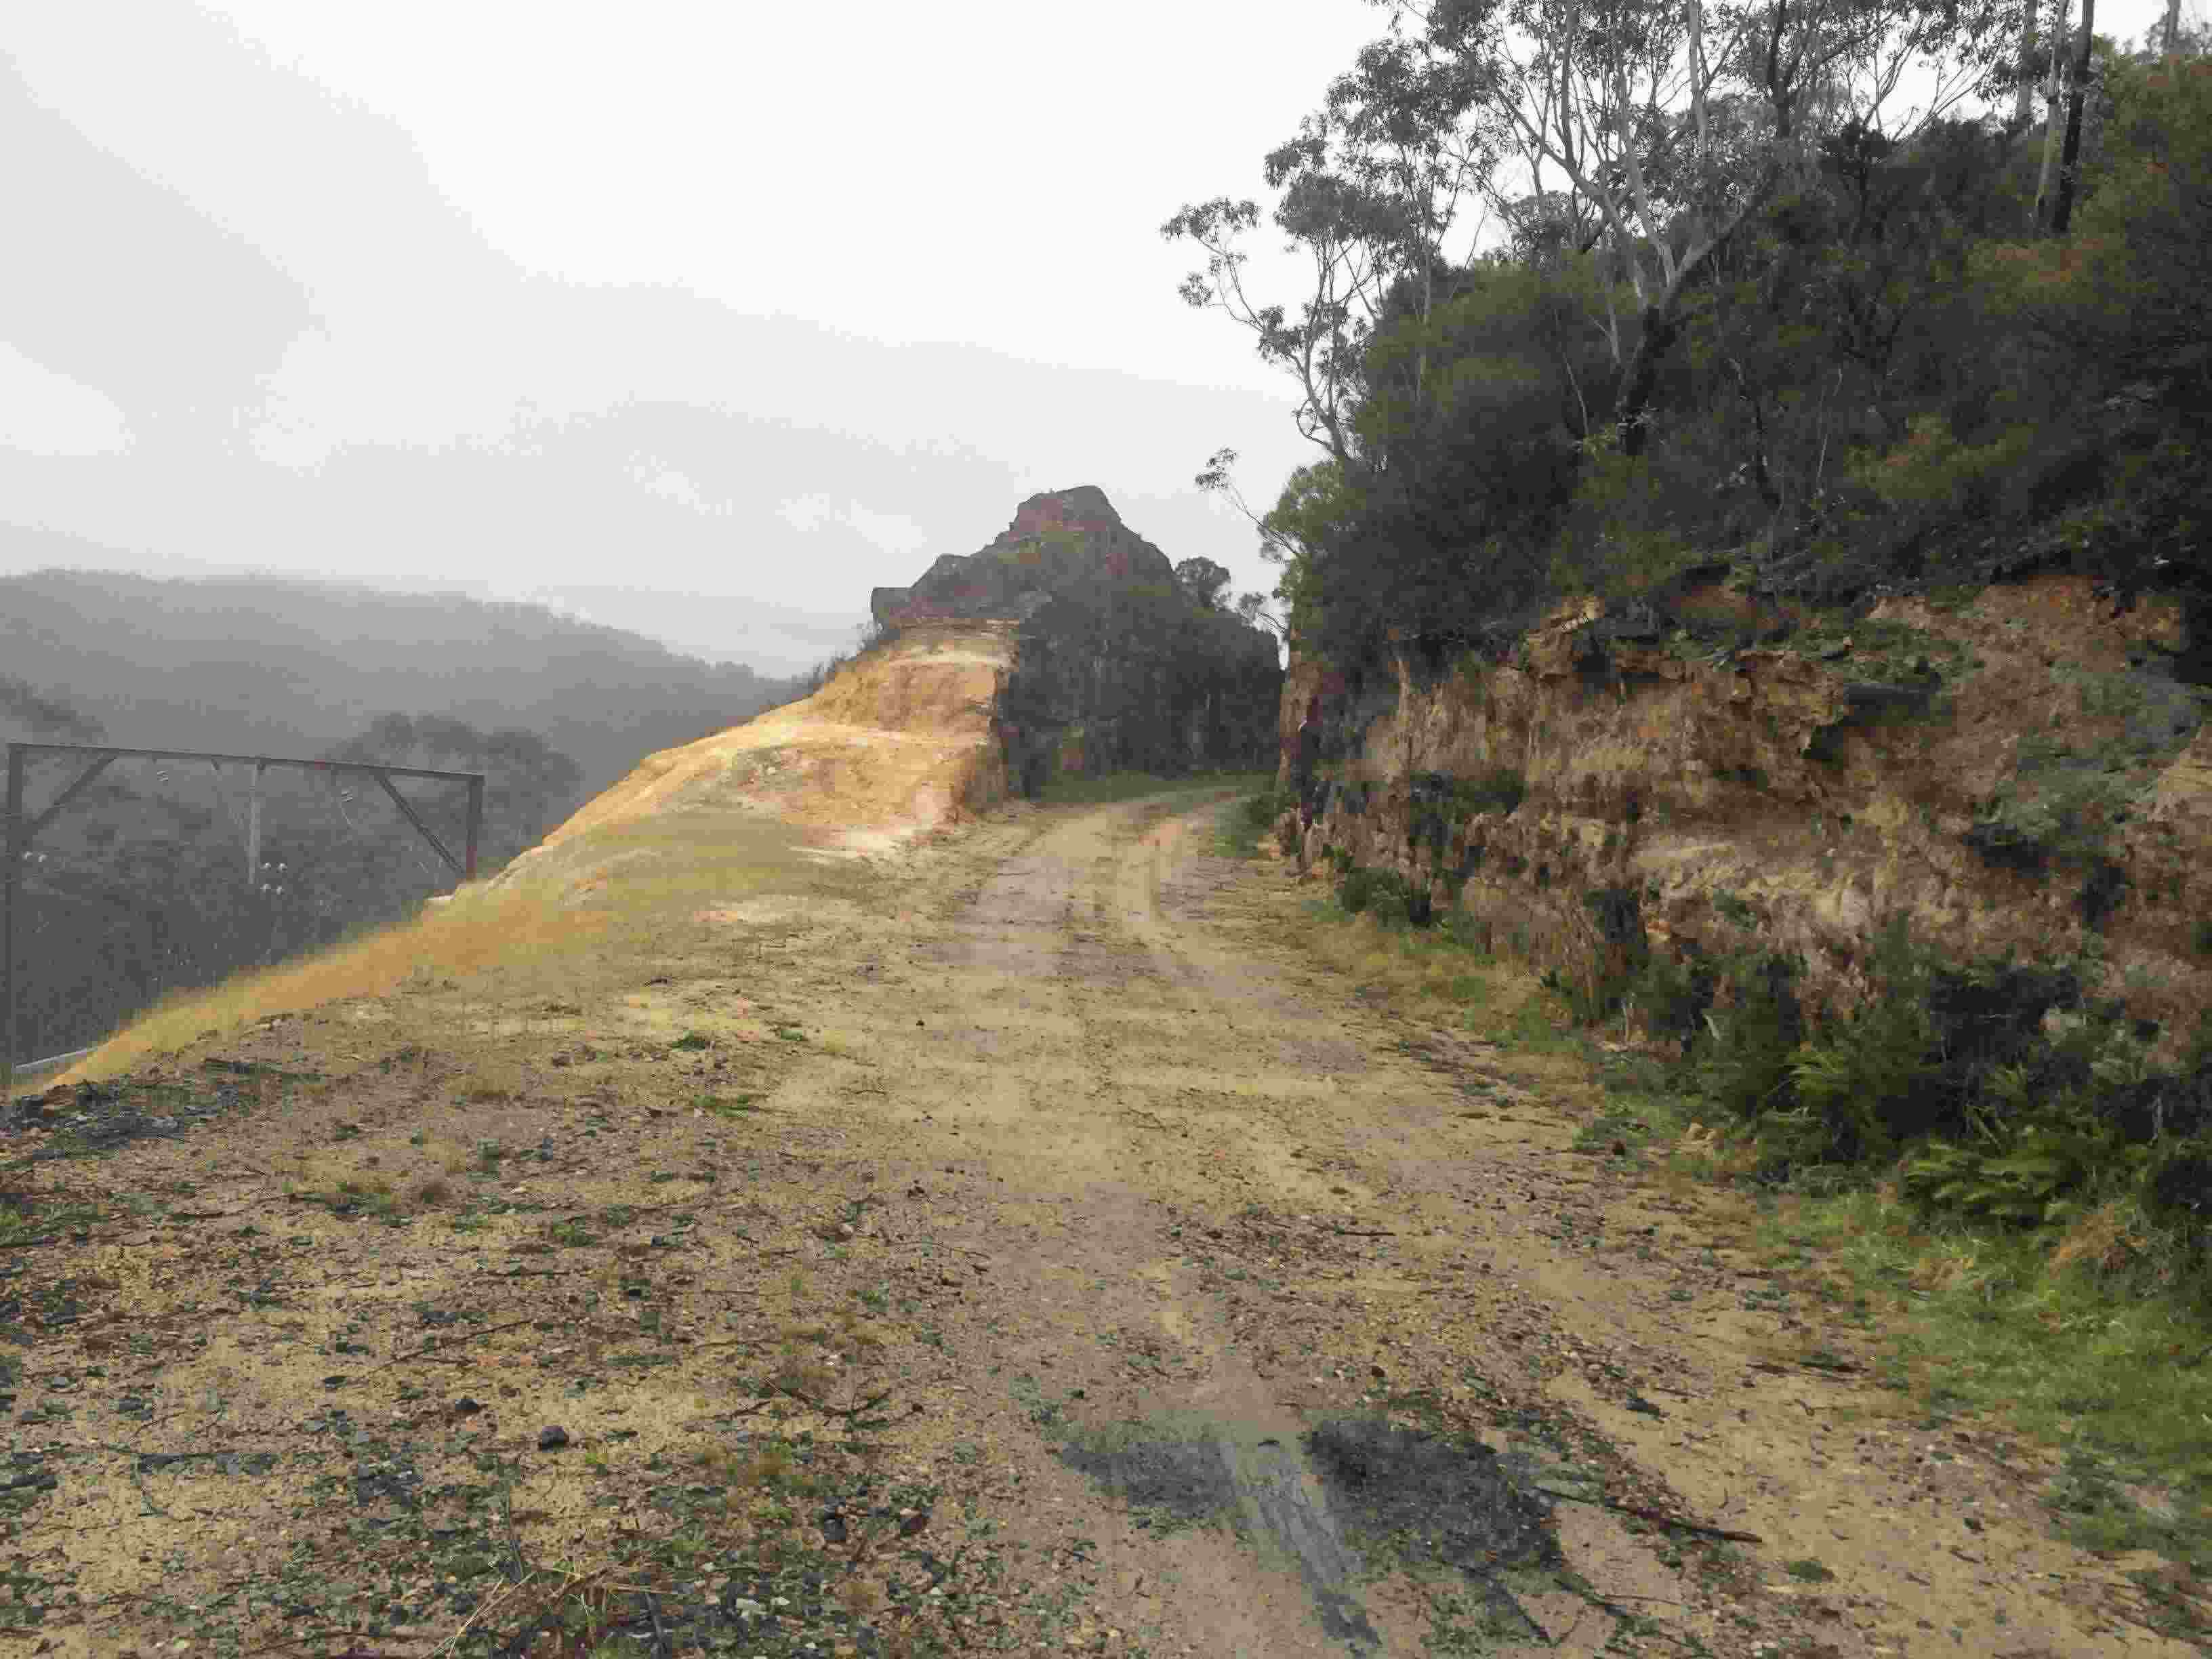
In contrast, a Rail Trail above and away from existing railway line
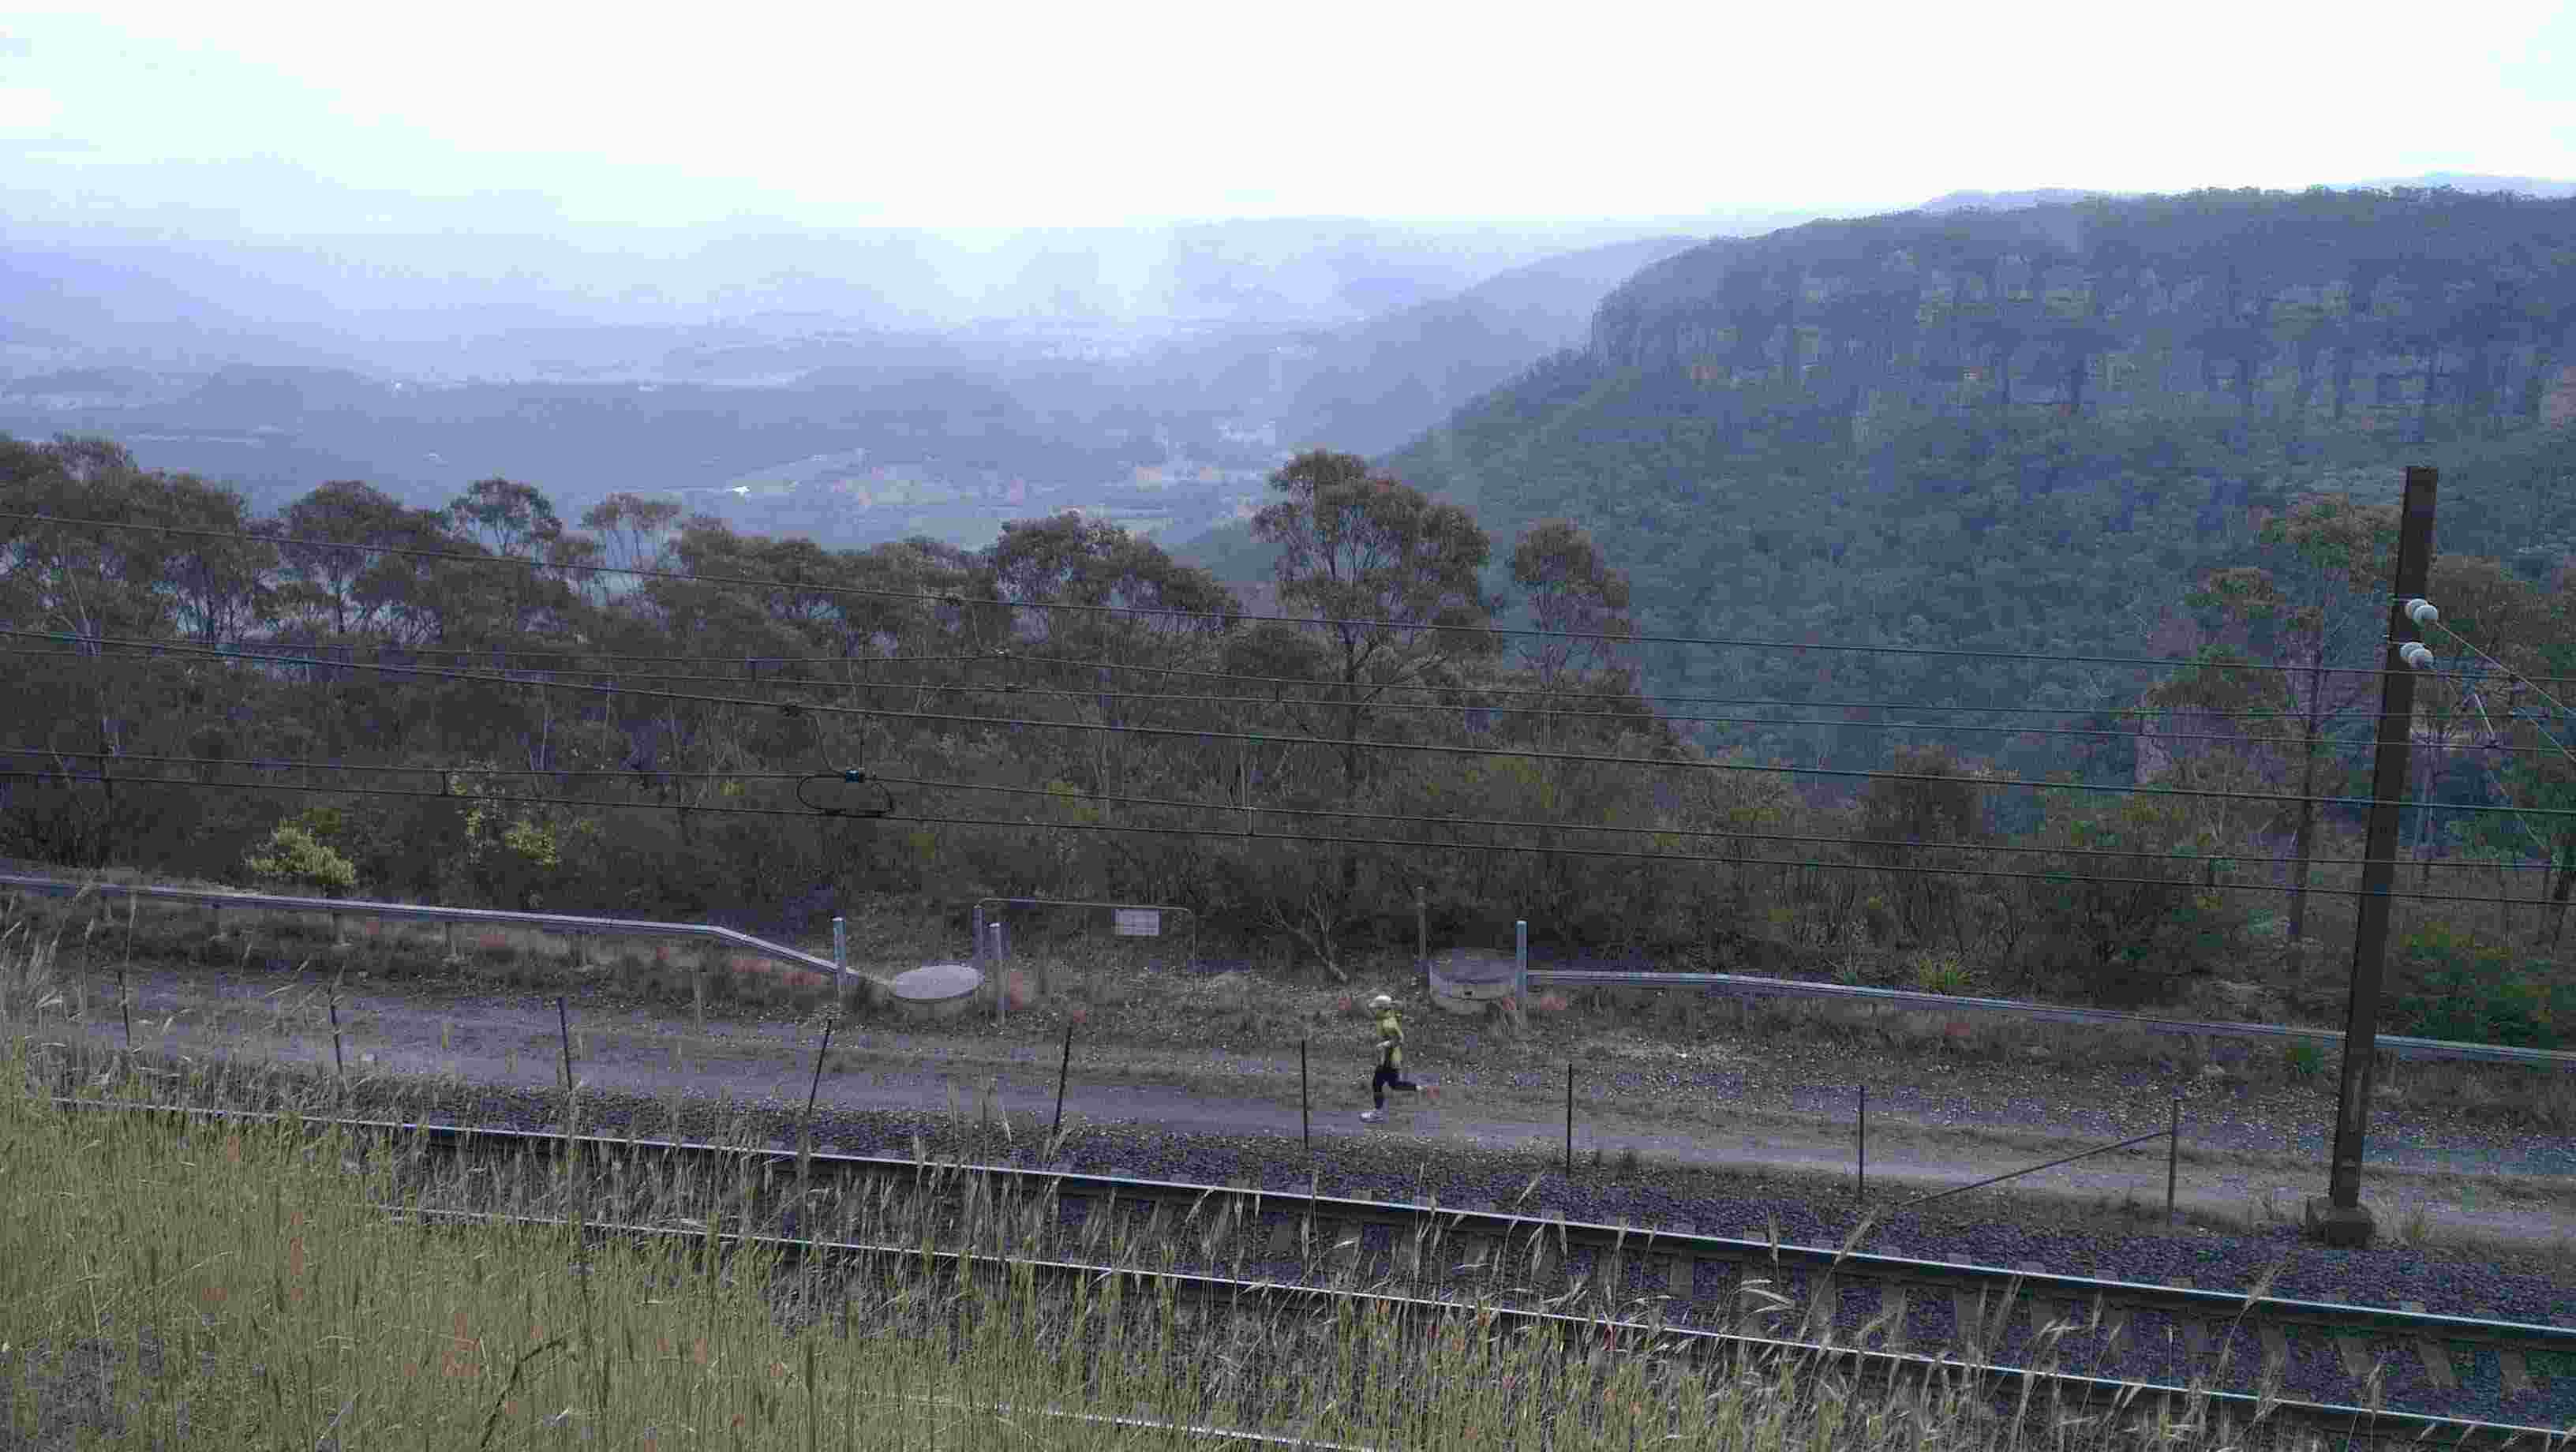
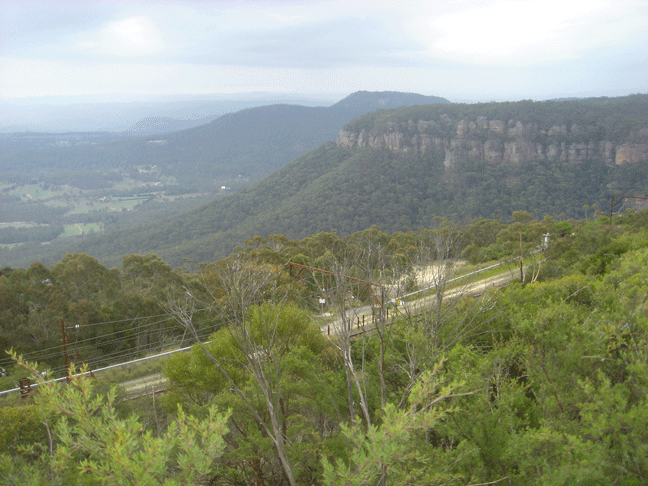
Spectacular 'world class' views of the Megalong and Kanimbla Valleys and Jenolan Forest in the distance
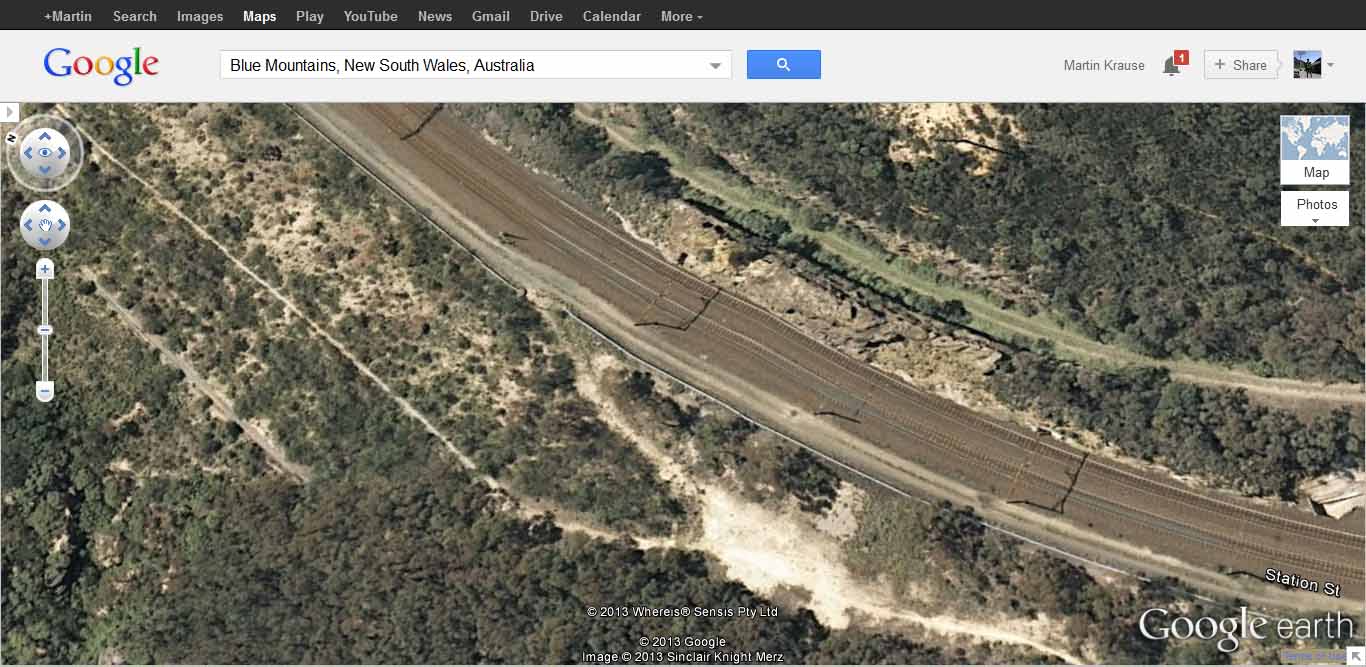
Rail Trail cutting viewed from above
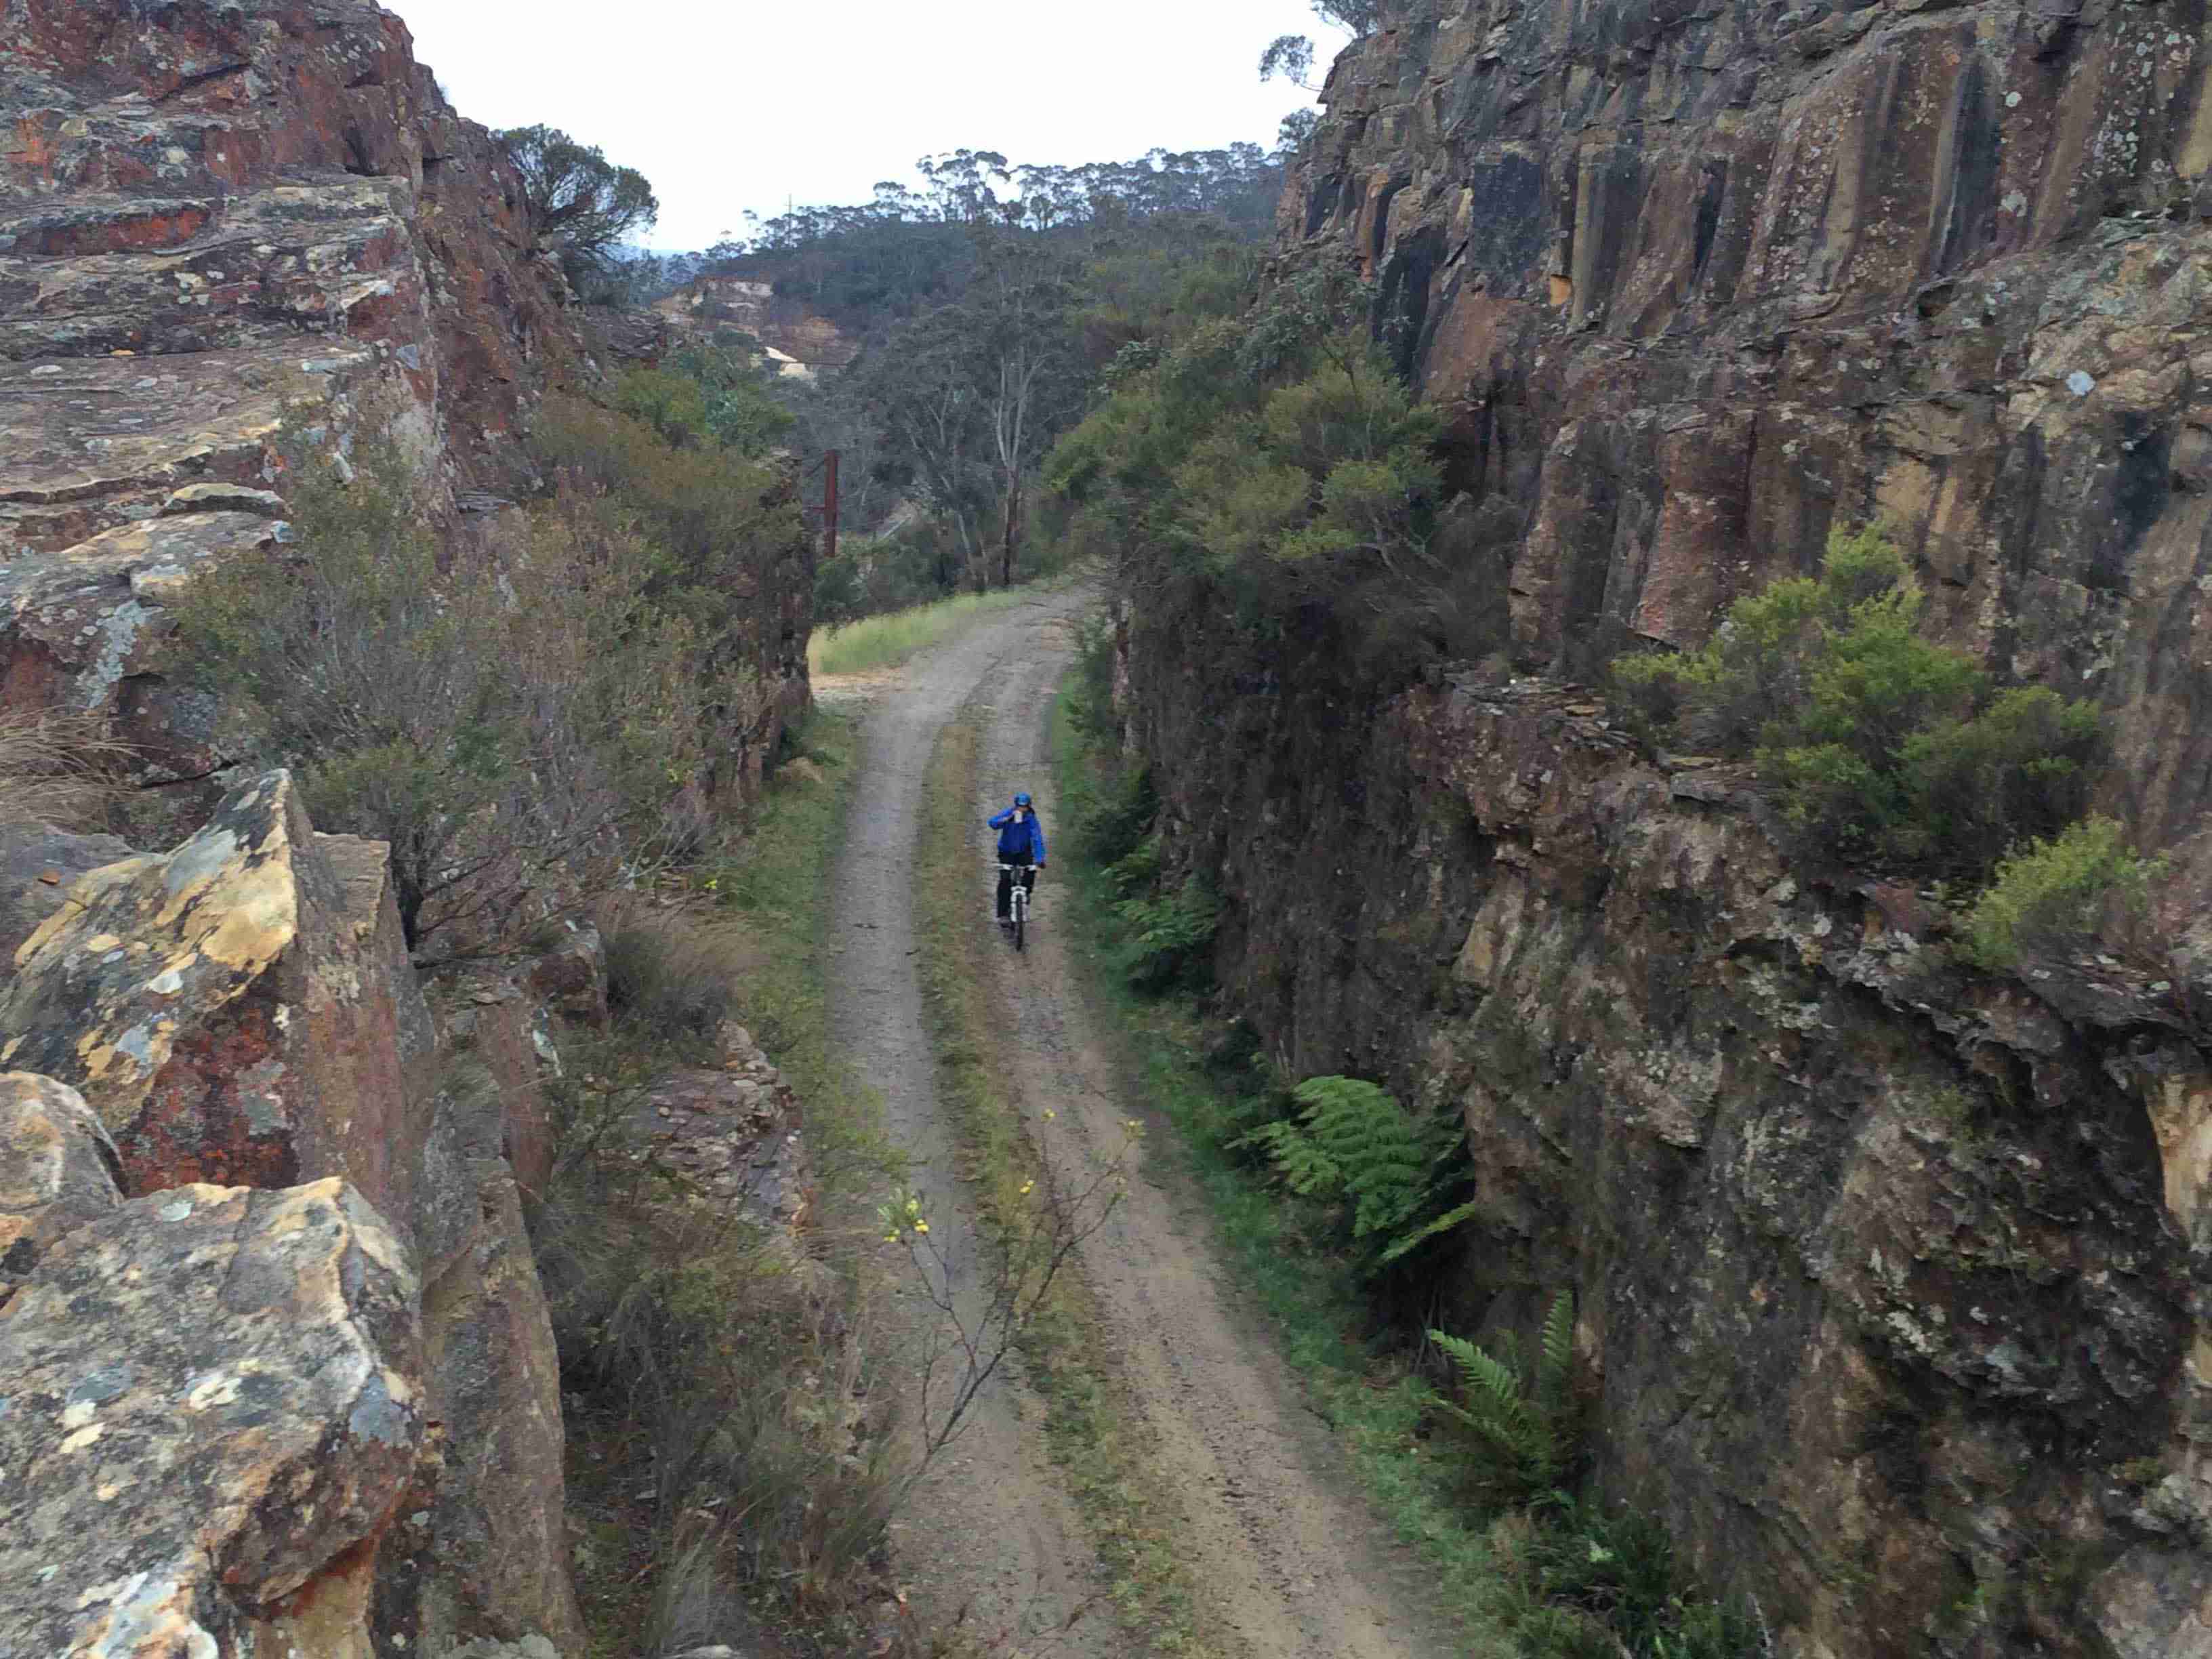
Rail Trail cutting with cyclist heading towards Blackheath on gentle railway gradient
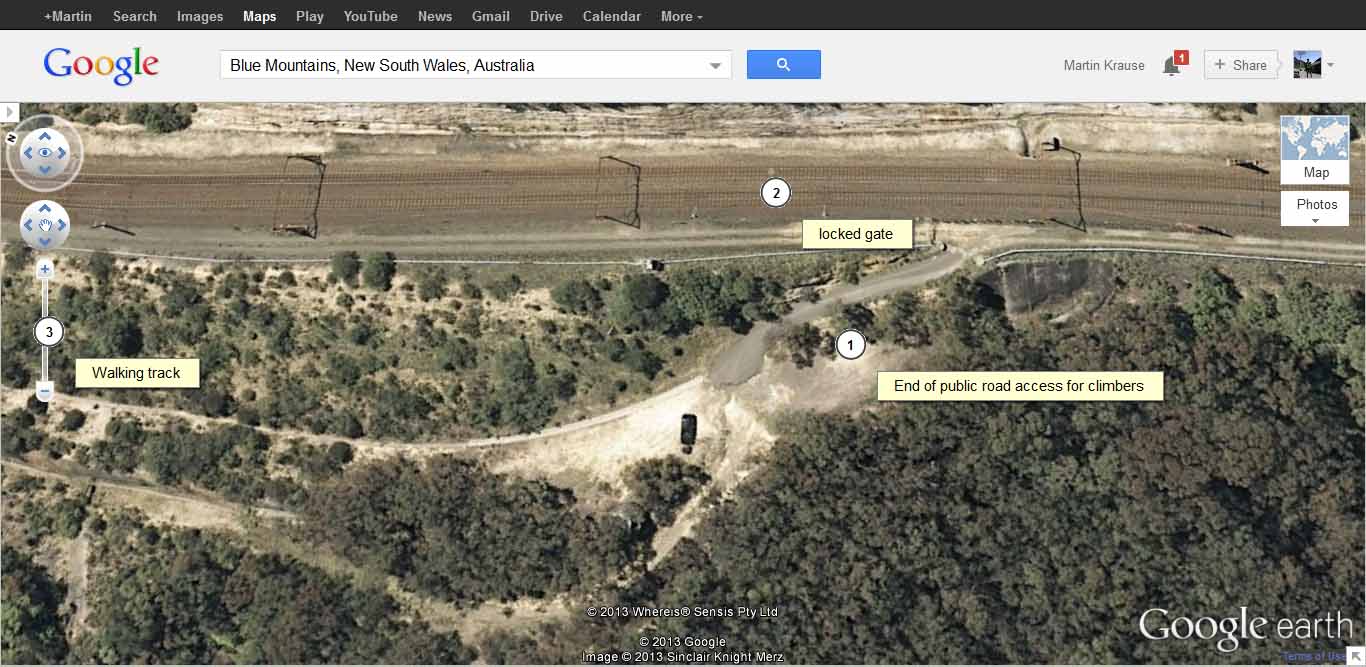
Locked Gate and Car Park for Rock Climbing
The only impediment to a trans-mountains trail is the opening of the rest of this track (900m). Currently, over three quarters the track is open for use and has been since the 1990's. In that time, there hasn't been a single incident involving trains, maintenance vehicles and rock climbers accessing this area. The usual excuses for not opening the remaining track are 'emergency access', 'liability' and 'signalling'. At this point, I would think upgrading the trail will improve access to emergency and maintenance vehicles. Liability has been dealt with for years with the above signage and I'm sure working around signalling isn't a major engineering feat.
Alternatively, there is the Rail Trail on the opposite side to the Trail beside Rail which would be even better. If it were possible to have both then a round trip would be possible. During the current upgrading of the GWH at Mt Victoria and at Blackheath, the RMS would need to build a short path in Blackheath and Mt Victoria in addition to providing a safe cycle and pedestrian crossing of the Railway Line on the GWH bridge at Mt Victoria. The Rail Trail would also solve the much vexed issue of peoples inability to use active transport to reach Brown Town Oval.
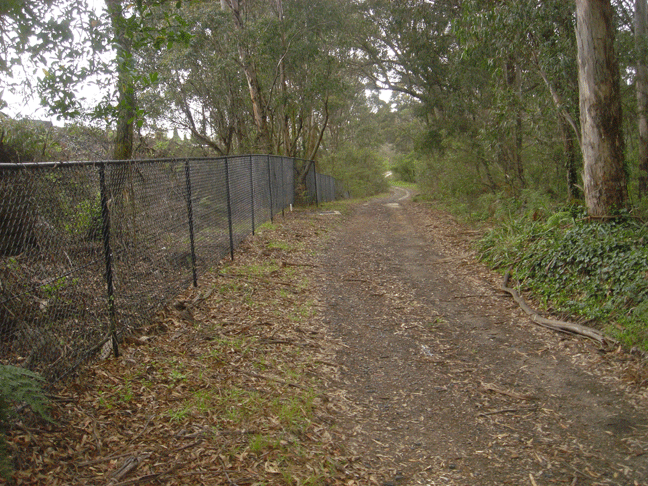
The Mt Victoria end of the track looking south east.
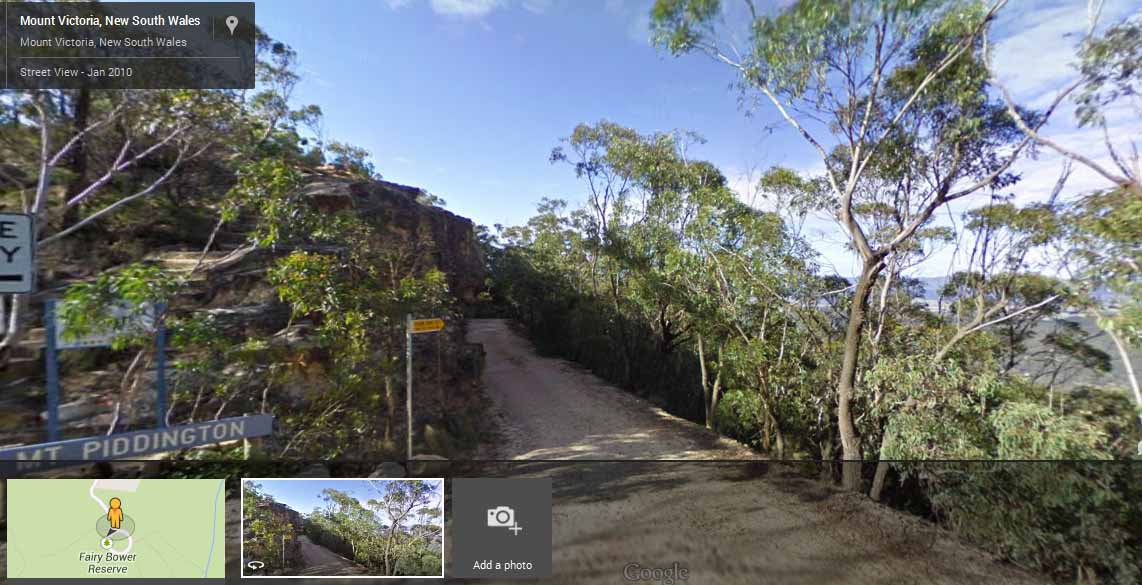
Fairy Bower and Mt Piddington Nature Reseve, at the Mt Victoria end of the trail.
The beauty of the cycling trail alignement is that it allows for dual mode transportation of bikes with trains.
Citations
• Centre for accident research and road safety, 2011, State of the Road: Bicycle Safety Fact Sheet
• Garrard J, Greaves S, Ellison A 2010 Cycling injuries in Australia: Road safety's blind spot? Journal of the Australasian College of Road Safety – August 2010
• Jacobsen P 2003, "Safety In Numbers: More Walkers and Bicyclists, Safer Walking and Bicycling," Injury Prevention (http://ip.bmjjournals.com), Vol. 9, pp. 205-209.
• Knowles J et al 2009. Collisions involving pedal cyclists on Britain's roads: Establishing the causes. United Kingdom: Transport Research Laboratory
• Litman T 2009, Transportation Cost and Benefit Analysis Guidebook, VTPI (www.vtpi.org/tca).
• Marshall WE and Garrick NW 2011, "Evidence on Why Bike-Friendly Cities Are Safer for All Road Users," Environmental Practice, Vol 13/1, March; at http://files.meetup.com/1468133/Evidence%20on%20Why%20Bike-Friendly.pdf
• Pucher J, Buehler R. Making cycling irresistible: Lessons from the Netherlands, Denmark and Germany. Transport Reviews, 2008; 28(4), 495-528
• Richardson DB 2009 Amalgamation of police and hospital trauma data in the Australian Capital Territory. Canberra: Australian National University Medical School
• Robinson D 2005, "Safety in Numbers in Australia: More Walkers and Bicyclists, Safer Walking and Bicycling," Health Promotion Journal of Australia, Vol. 16, No. 1 (www.healthpromotion.org.au), April, pp. 47-51.
• RMS (2014) : http://www.rms.nsw.gov.au/roadprojects/projects/western_region/mt_victoria_lithgow/documents/140422_potential_treatments_report.pdf
• Turner SA, Fleming T (Allatt), and Tarjomi L (2013), Reallocation of Road Space, Research Report 530, NZ Transport Agency (www.nzta.govt.nz);
• S.A. Turner, A. P. Roozenburg and T. Francis (2006), Predicting Accident Rates for Cyclists and Pedestrians, Land Transport New Zealand Research Report 289 (www.ltsa.govt.nz); at www.ltsa.govt.nz/research/reports/289.pdf
• Turner, R. Singh, P. Quinn and T. Allatt (2011), Benefits Of New And Improved Pedestrian Facilities – Before And After Studies, Research Report 436, NZ Transport Agency (www.nzta.govt.nz); at www.nzta.govt.nz/resources/research/reports/436/docs/436.pdf
.• van Essen HP et al. 2007, Methodologies For External Cost Estimates And Internalization Scenarios: Discussion Paper For The Workshop On Internalisation On March 15, 2007, CE Delft (www.ce.nl); at www.ce.nl/4288_Inputpaper.pdf
• Wood, J.M., Lacherez, P.F., Marszalek, R.P., & King, M.J., 2009, Drivers' and cyclists' experiences of sharing the road: incidents, attitudes and perceptions of visibility, Queensland University of technology, http://eprints.qut.edu.au/29579/1/29579.pdf, p.3
Blackheath to Mt. Victoria Rail Trail and Soldiers Pinch
An Historic Rail Trail Built In The 1860’S
: NSW Rail Trails submission 2014
A preliminary submission to notify Rail Trails for NSW to the existence of a long forgotten disused section of the original trans mountains railway line. Built during the age of steam by the Tasmanian contingent of Royal Engineers and opened circa 1867 between Blackheath and Mount Victoria at the top of the New South Wales Blue Mountains.
The Blackheath to Mt. Victoria is a unique Rail Trail that has remained isolated in time and detached from progress and development for over 115 years. It not only offers a fantastic opportunity to see back in time to the early engineering and pioneering development of the area, but also further back in time to the first Australians to also share in their history of the region delivering a dynamic visitor experience.
Combined with this history are the splendid uninterrupted picturesque views within this world Heritage Area and of the beautiful Kanimbla Valley below.
Innovative opportunities to develop tourism and grow employment are greatly needed in our region and the Blackheath to Mt. Victoria Rail Trail will provide a positive return on investment through the delivery of funds and grants on this very special Rail Trial.
Historical Perspective : Due to the lack of civilian surveys in the 1860’s, the Royal Engineers from Tasmania were deployed in Western Sydney New South Wales to scope, survey and build a rail line stretching from the town of Parramatta out west to the rapidly growing township of Bathurst. This meant crossing the greater Blue Mountains that is well over 1000 meters in height. In stark contrast the Blue Mountains, western line from Parramatta to rural area of Emu Plains just past the major township of Penrith could not be any more different. Here it was predominately flat and required little creative engineering other than a viaduct and a small number of bridges.
The track from Emu Plains to the other side of the mountains towards the first main township of Lithgow on the other side of the Mountains however was considerably different. This meant scaling a mountain over one kilometre high. It would require considerable engineering, viaducts and bridges to get to the top at Blackheath and Mt. Victoria some 120 kilometres from Central Station in Sydney. Lapstone was considered the first stop on the Mountain.
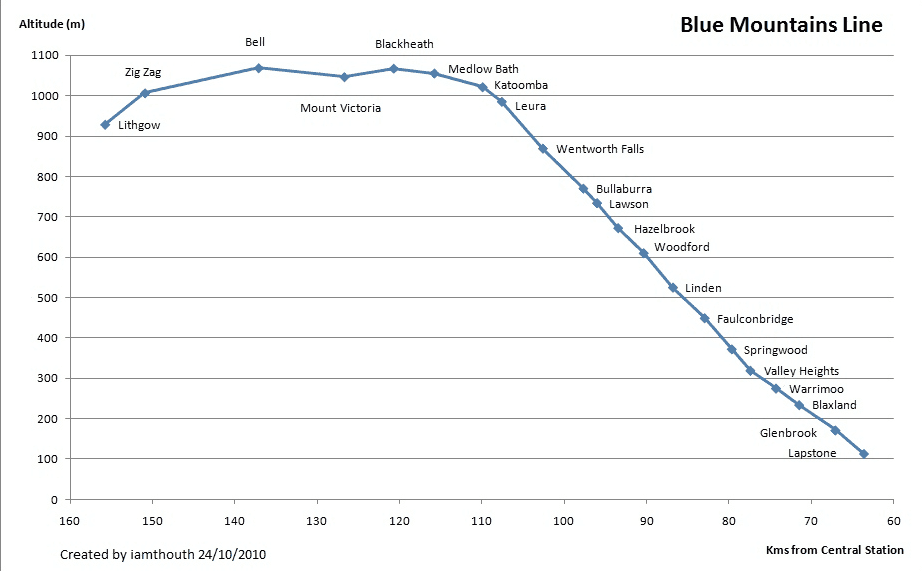
Along multiple locations across the Blue Mountains the route has breath taking views across several valleys and escarpments including the Jamison Valley, Megalong Valley and Kanimbla Valley just to name a few.
This line began opening around 1867 as single-track railway line that lasted unchanged and in constant use for the next 30 years. As the demands for the service crossing the Mountains increased along with the ability to build a better rail network, a survey was commissioned in 1896 to improve the grades and curves across the Blue Mountains.
Work commenced on the line improvements in 1897 and they were completed around 1903. Several interesting sections of the original rail line were annexed from the active line. The most significant of these is between Blackheath and Mt. Victoria as result of what was known as The Soldiers Pinch Deviation. Here a second dual line was created below the original single that was decommissioned.
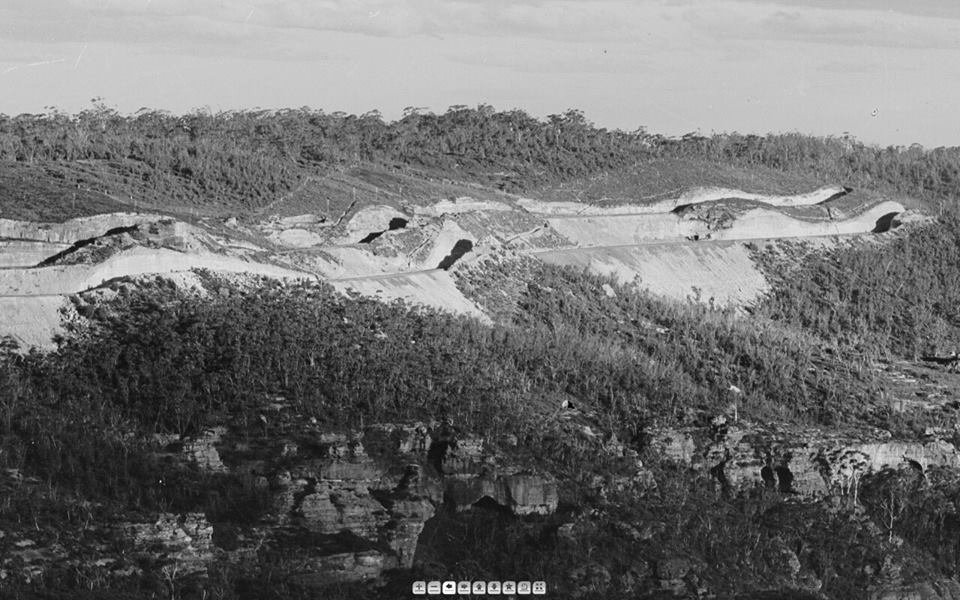
Near the very top of the Mt. Victoria Pass between Mount Boyce and Browntown Oval is an area called Soldiers Pinch. It was named after a story of an unfortunate soldier involved in an accident that may have occurred well before 1839 during the formation of the original carriageway. This soldier unwittingly placed his foot under a very heavy wheel to block it instead of a stone. According to G Whalan’s Trip over the Mountains several years later, his foot was subsequently ‘crushed to atoms’. It is believed that the unfortunate soldier died as a result.
Unique Features
Due to the isolation of the track in this remote region of the Blue Mountains, several significant historical features of the potential Blackheath to Mt. Victoria Rail Trail including the Soldiers Pinch section remain today as it was in the late 1800’s. With no further public works or reuse for other activities other than occasional emergency vehicle access, this former rail line has been left silent. Less only rail sleepers, it has been preserved in its original state for over 115 years. Many old steel sleeper pins can be found strewn across the trail.
One of the features that make Blackheath to Mt. Victoria Rail Trail a rare example is that the culverts are made of heavy sandstone at both ends, where most that are still found across NSW have been refurbished on at least one side with bricks.
Sandstone Culverts along the Blackheath to Mt. Victoria Rail Trail
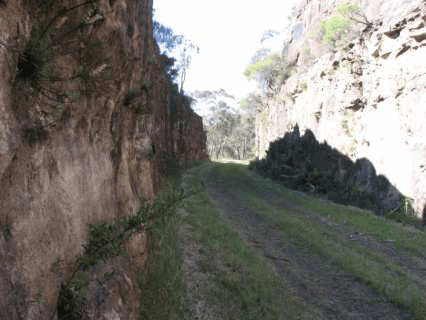
Culverts are drainage tunnels that carry runoff water from one location to another. The most common sources of the water are natural rainfall and storm water and the most common use of the culvert is to carry the runoff under a road or railway line.
Large culverts have been built to carry streams. Culverts in the Blue Mountains have been constructed with wood, stone, brick and more recently concrete. Sandstone culverts range in width from 450 mm (1 ft 6 inches) through the most common 600 mm (two foot) to less common 900 mm and on up to 2700 mm. The first railway line came through Blackheath in the late 1860s and many sandstone culverts were built at that time. These were mainly 600 mm wide sandstone culverts, commonly known as box culverts. As Blackheath grew and the second rail line came through in the early 1900s, the roads were modified and sandstone culverts suffered badly. In most cases either the entrance or exit was extended with brick and sometimes concrete, some entrances were grilled to stop access, and sometimes access was restricted by earthworks. As a result it is now unusual to find an intact sandstone culvert in its original condition. There do not appear to be any such between Medlow Bath and Blackheath and none in the immediate vicinity of Blackheath village itself. However, around Mount Boyce on the eastern side of the current railway line there is a stretch of disused line from which the rails have been removed and which appears to have remained largely undisturbed over the last hundred years. It contains several cuttings and at least seven pure sandstone culverts.
It runs parallel to the existing line and about 15 m to 20 m to its east. It rises from being about 3 m above the line close to Mount Victoria to being around 10 m above the line close to Mount Boyce. The course of the track is indistinct at both ends where extensive earthworks have been carried out however there is a section of about 2 km that has been minimally damaged. It is here that the sandstone culverts are best seen. Due to the culverts being located away from the current rail line we have simply given them sequential numbers with the prefix S. These are sequential and increase with distance from Blackheath. Location details are tabulated at the end of this work Sandstone culverts were constructed with rectangular handmade blocks of sandstone. The floor of the culvert is usually composed of three parallel rows of sandstone slabs laid lengthwise.
The floor has a slight fall over the length of the culvert. While this fall is sufficient for water to drain away, it is sometimes insufficient to maintain solids in suspension, resulting in build up of sand, soil and vegetation and ultimately to the blockage of the culvert. Maintenance procedures on active rail lines include the regular inspection of culverts and debris clearance where necessary. Partially and totally blocked culverts are commonly encountered on abandoned sections of a line
Tourism
The Blue Mountains Rail Trail is a short but very historically significant 2.5km section of rail bed. It is in original condition since the sleepers were removed around 115 years ago, untouched by any further development.
This section of trail is perfectly accessible by townships and train stations at both ends of the trail, plus it is linked into other bike trails both eastern and western ends. Uninterrupted mountains and valley views adorn the trail limited only by the technical ability of a visitor’s camera to capture these stunning views. A strong variety of ‘money’ shots exist to expose this area on international and domestic tourism brochures.
Of the six local indigenous nations, 2 are well represented in the area. They are in support of the Rail Trail and are interested in providing information relative to their history where appropriate along the Rail Trail and surrounding trails. History of the first explorers and most importantly the history of the rail line can be sign posted along the way.
The Rail Trail would become part of a network of trials currently in planning and under construction crossing the Blue Mountains. Interlinking shared bicycle/pedestrian pathways are being constructed between upper Blue Mountains villages providing access to the Rail Trail by Road, train and bicycle. The Blue Mountains is an important link in the greater Manly to Mudgee vision. The Blackheath to Mt. Victoria Rail Trail would be the jewel in the crown.
Leading the charge is the Blue Mountains City Council with their 2020 Bike Plan and a number of very enthusiastic bike groups advocated by the Blue Mountains Connected Communities Alliances Sustainable Transport Group.
Making the track accessible will require some rerouting and possible pedestrian/cycle bridge at the eastern end across the rail line at a location where the rail line is deep down in the cutting, making the construction of such an asset much cheaper than it would be if on the same plain. Although this would be the most logical and interesting solution, other viable alternatives exist. Sections of the Rail Trail establishment are a perfect fit for the work for the dole scheme.
Economic modelling for the rail trail has not yet been completed, however the number of tourists that may be attracted to the region could be around 2000 per month and many of these would be encouraged to stay for at least one night or extra night to their stay. This could increase overnight stays by around 3-5% per annum. This would provide a significant return on investment and a boost to the local economy each year in the tens of millions.
Data from 2011 census shows that unemployment in the upper Mountains was at least 50% higher than the national average of 5.6% with Katoomba at 8.4% and Mt Vic at 7.7%
The establishment of the Blackheath to Mt. Victoria rail trail would boost the local economy and offer more employment and business opportunities to residents particularly to those unable to commute long distances. The development of the Rail Trail supports the NSW government's regional growth plans as well as the Blue Mountains City Councils 2020 Bike Plan. The stated target of increasing employment in the Blue Mountains subregion from 2001 levels of 19,000 to 26,000 by 2031 - up by 7,000 in the Economy and Employment North West Key Directions document would also be supported.
Rail Trails in other areas have provided tangible evidence that formal Bike trails of any kind have had a very positive impact on tourism.
Lower Blue Mountains Rail Trail and Zig Zag Rail Trail
The Lapstone Zig Zag was a zig zag railway built near Lapstone on the Great Western Railway of New South Wales in Australia between 1863 and 1865, to overcome an otherwise insurmountable climb up the eastern side of the Blue Mountains. The ruling grade was already very steep at 1 in 33 (3%). The original plan had been to build the whole line across the Blue Mountains on a completely different route through the Grose Valley with a 3 km long tunnel, but this was beyond the resources of the colony of New South Wales at the time. The track included a now abandoned station called Lucasville which was built for the Minister for Mines, John Lucas who had a holiday home nearby.
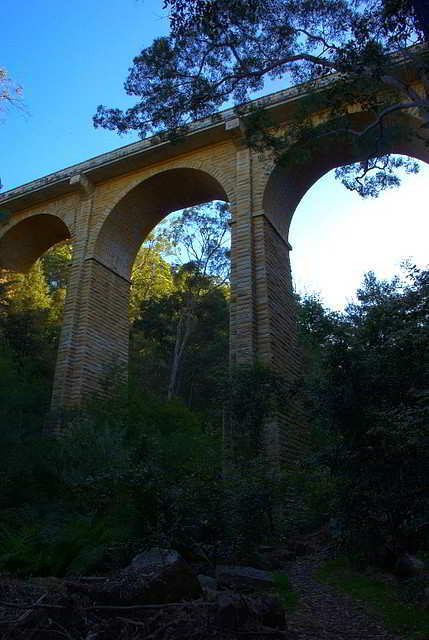
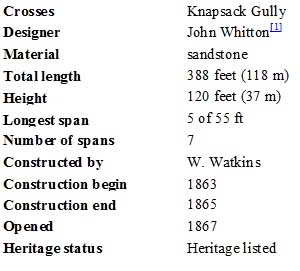
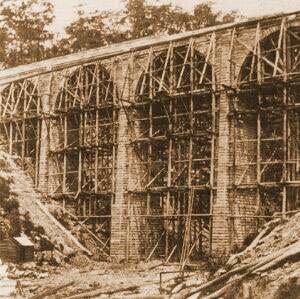
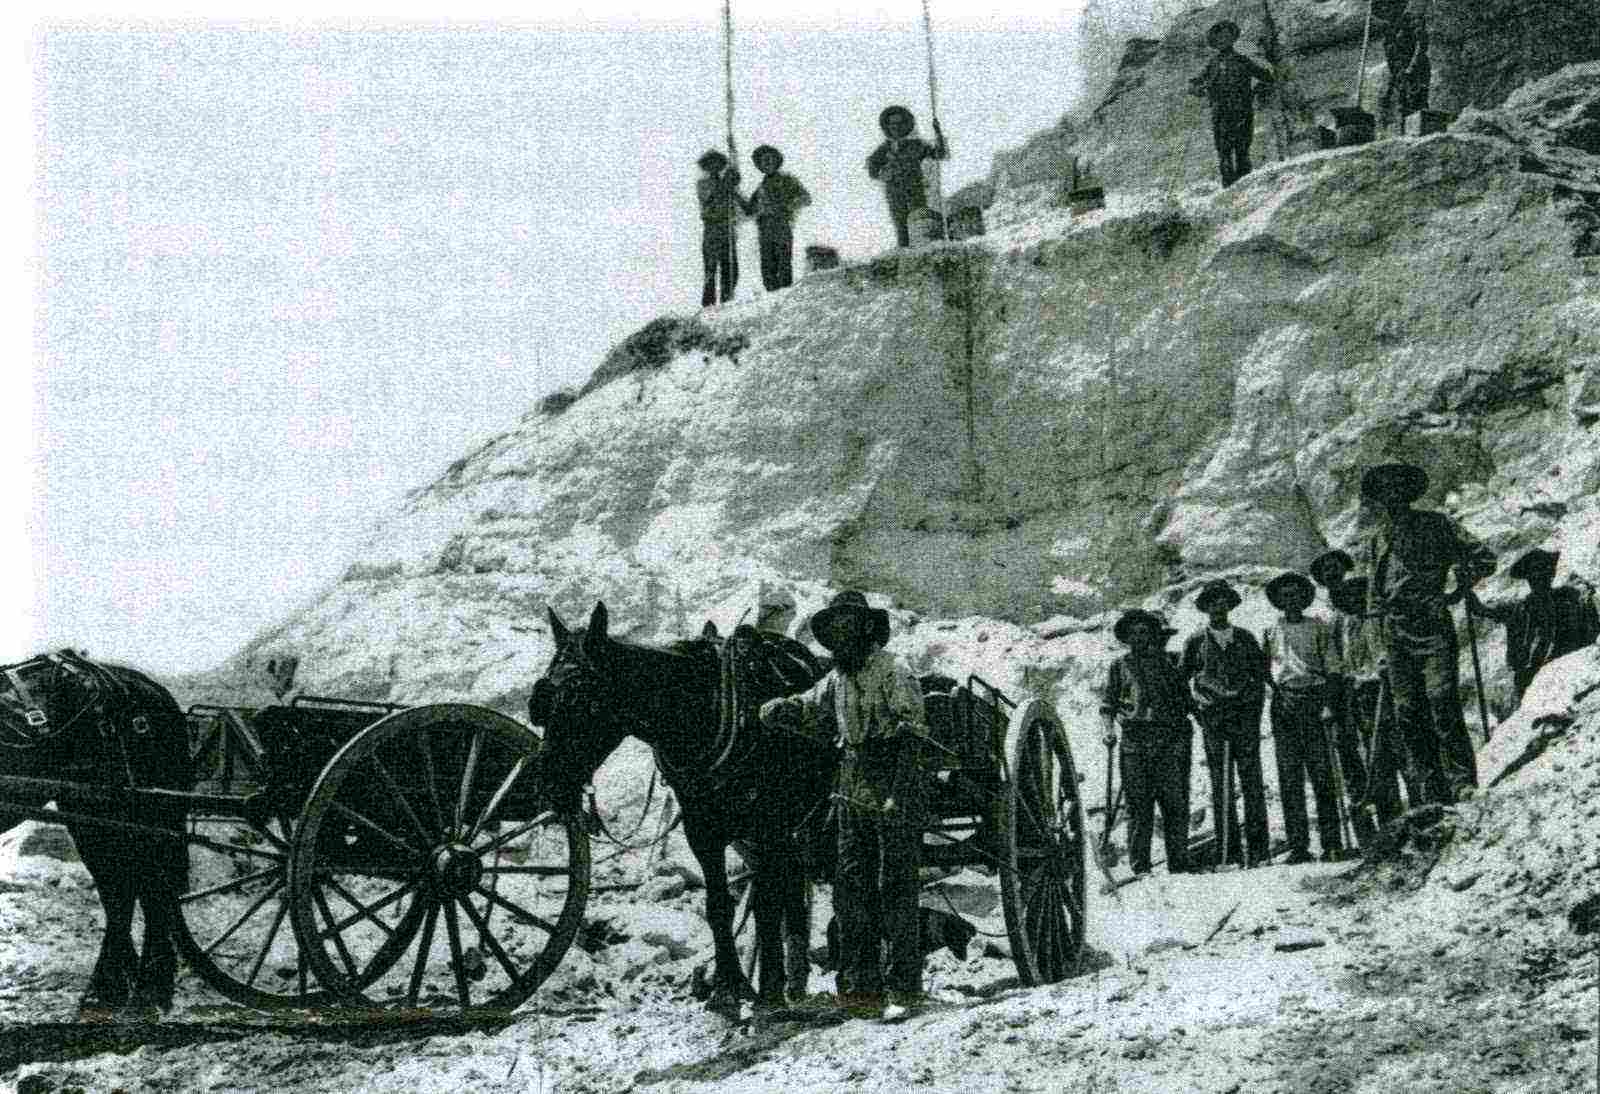
Blue Mountains council has already made some investment in cycling infrastructure in the region of the lower Blue Mountains Zig Zag Rail Trail
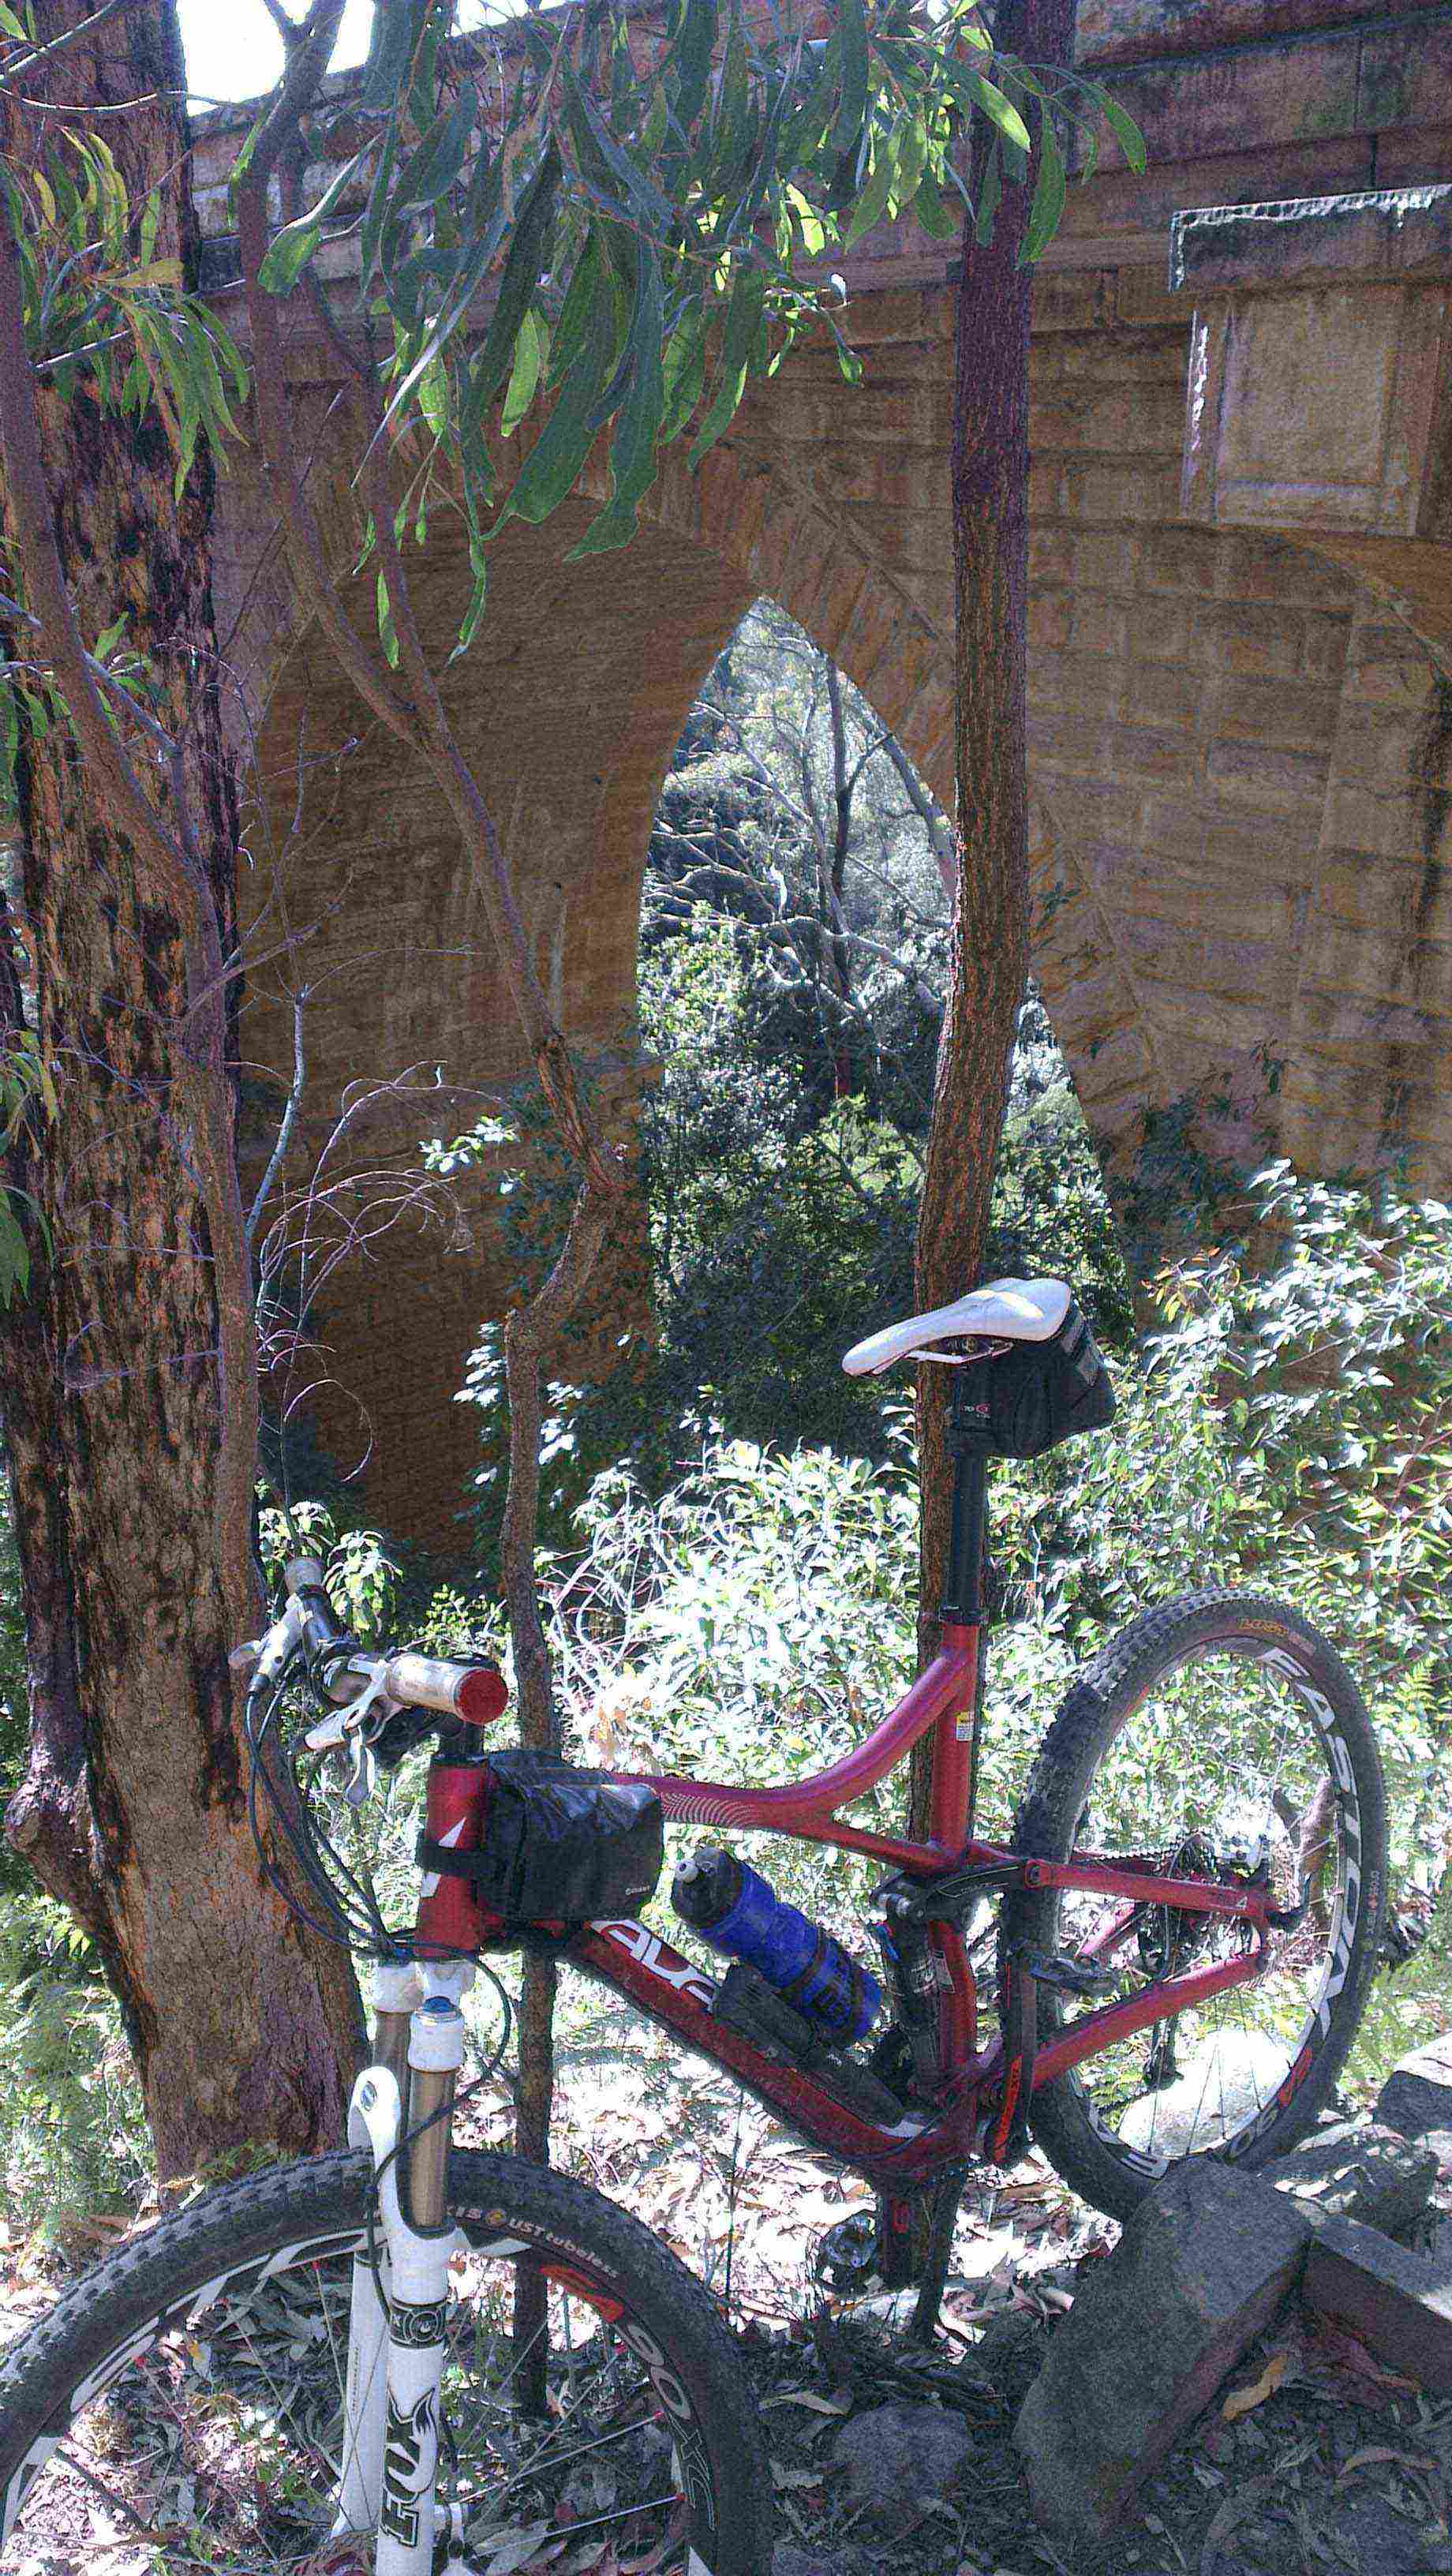
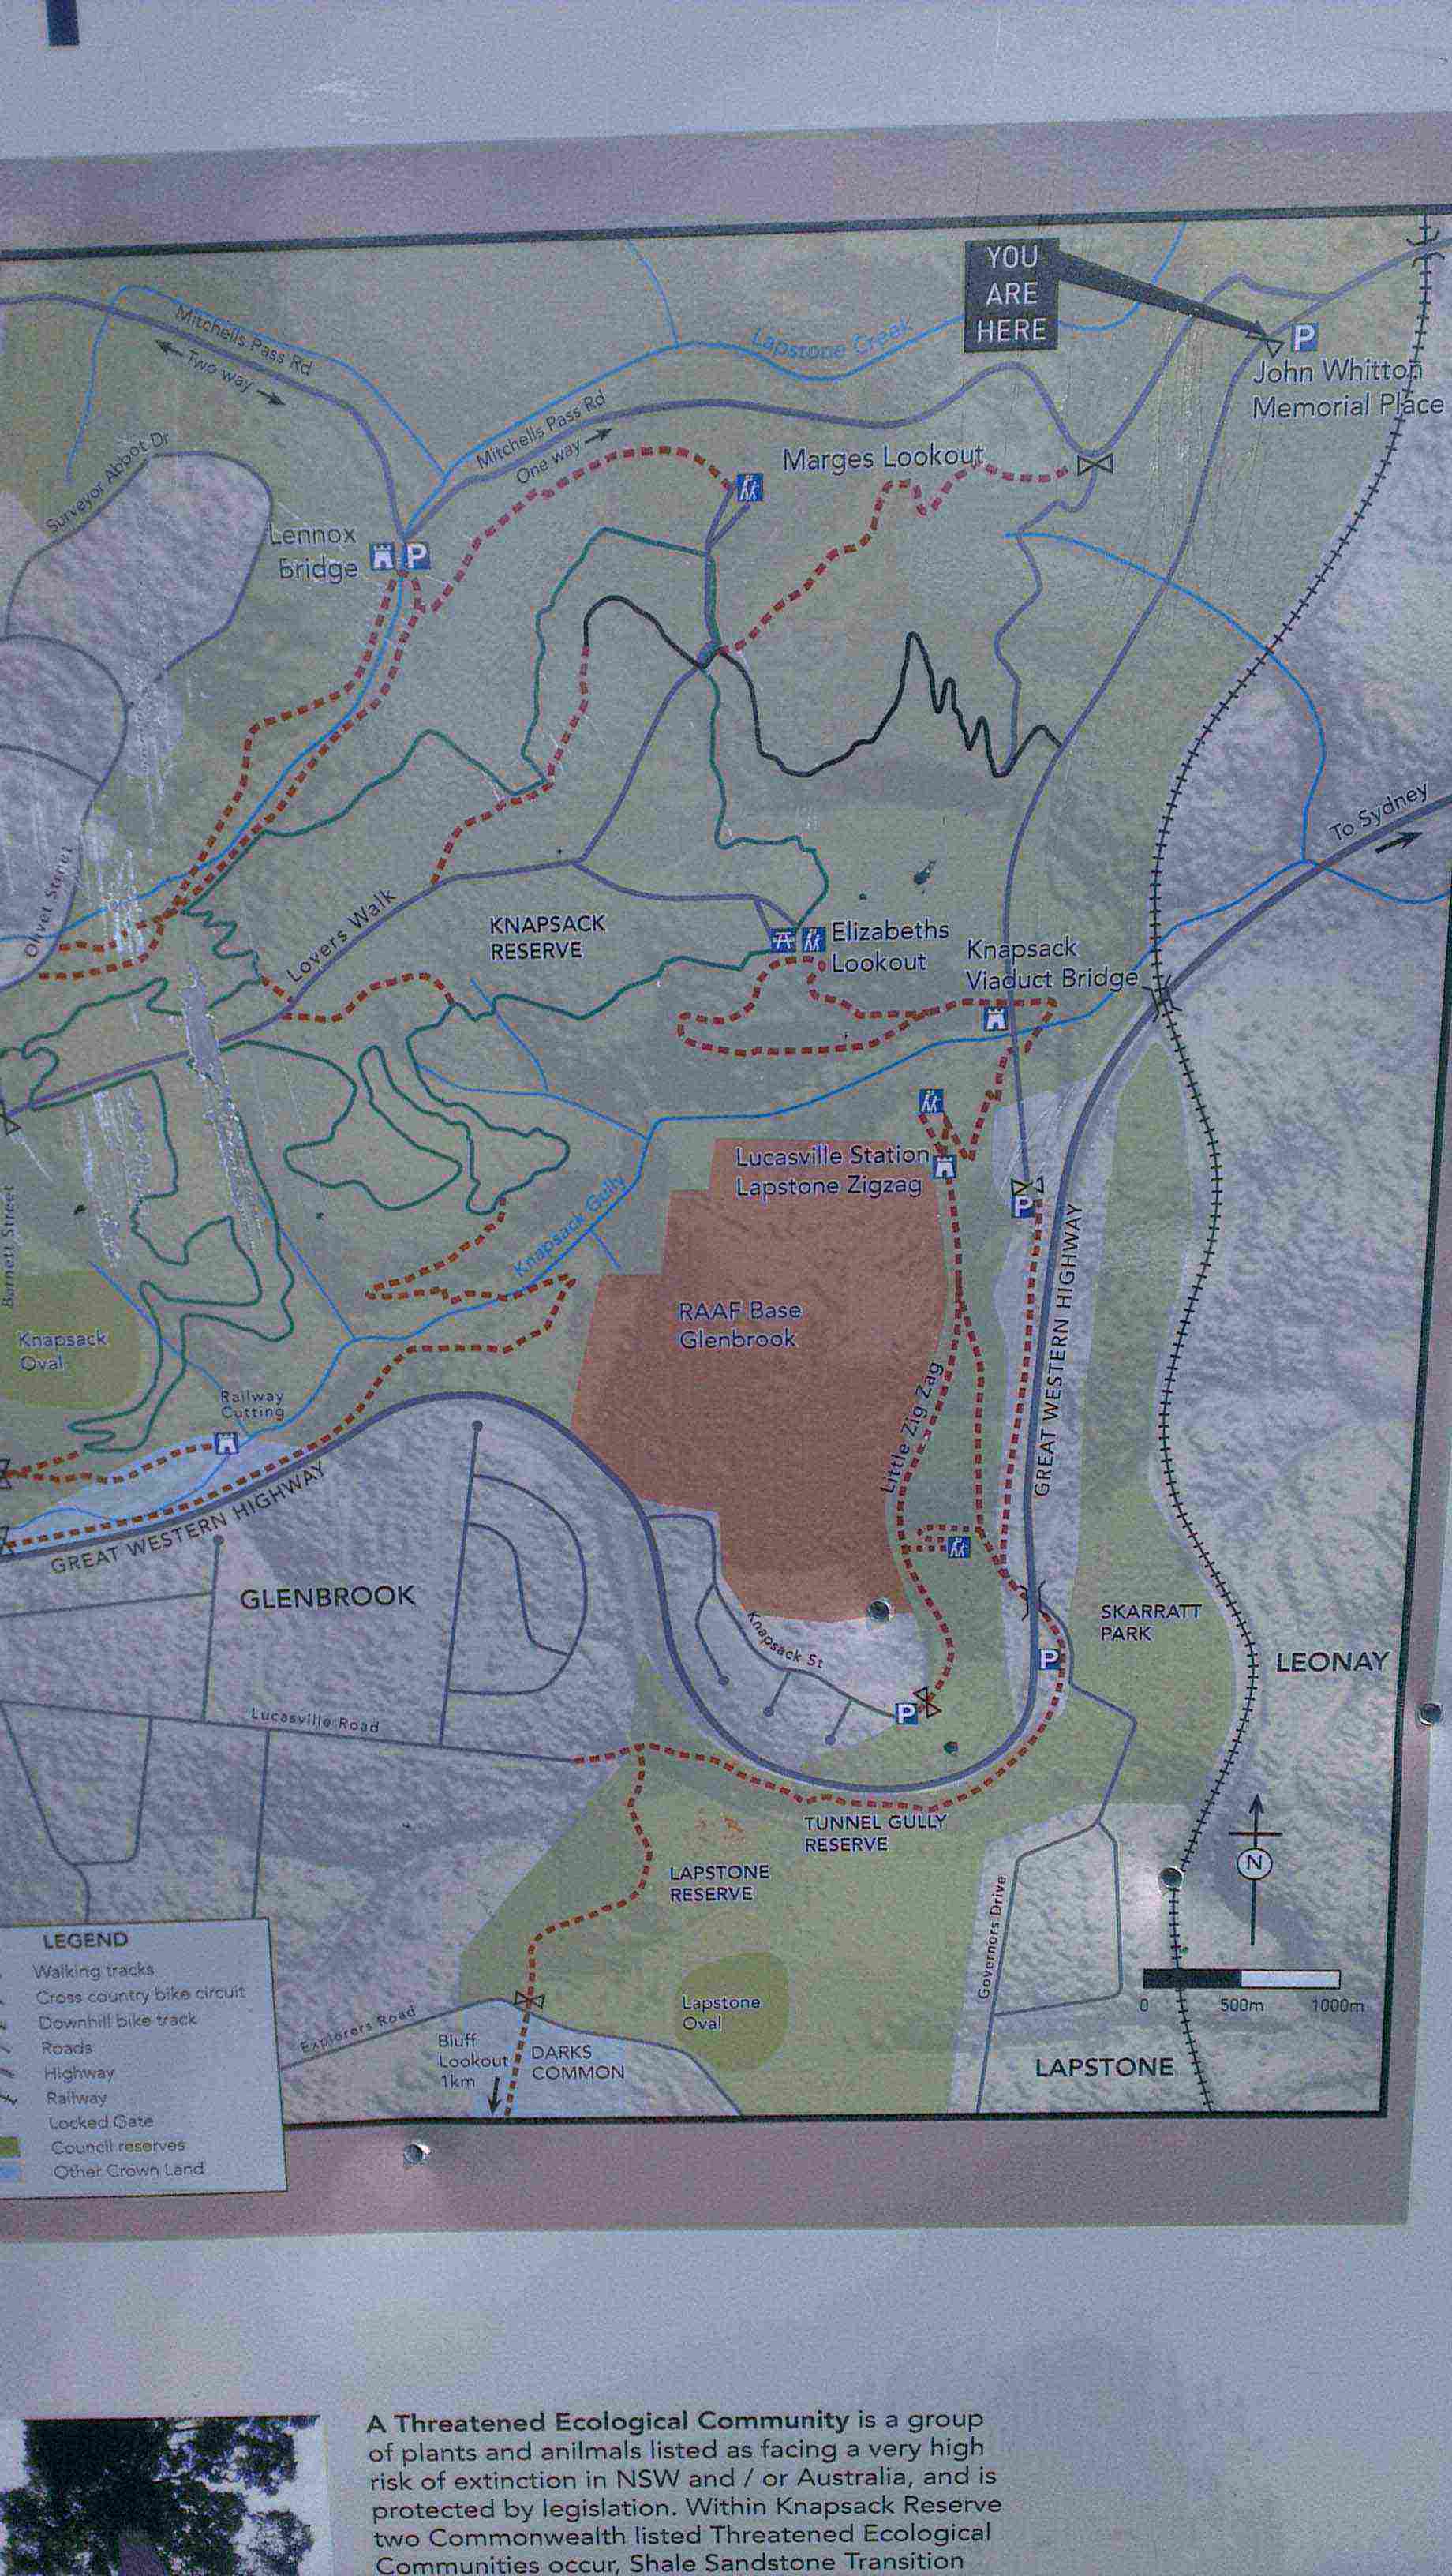
Note that the lower part of the Rail Trail has already been sealed by Penrith council. This would be the natural gateway to the Trans Mountains Cycle Trail
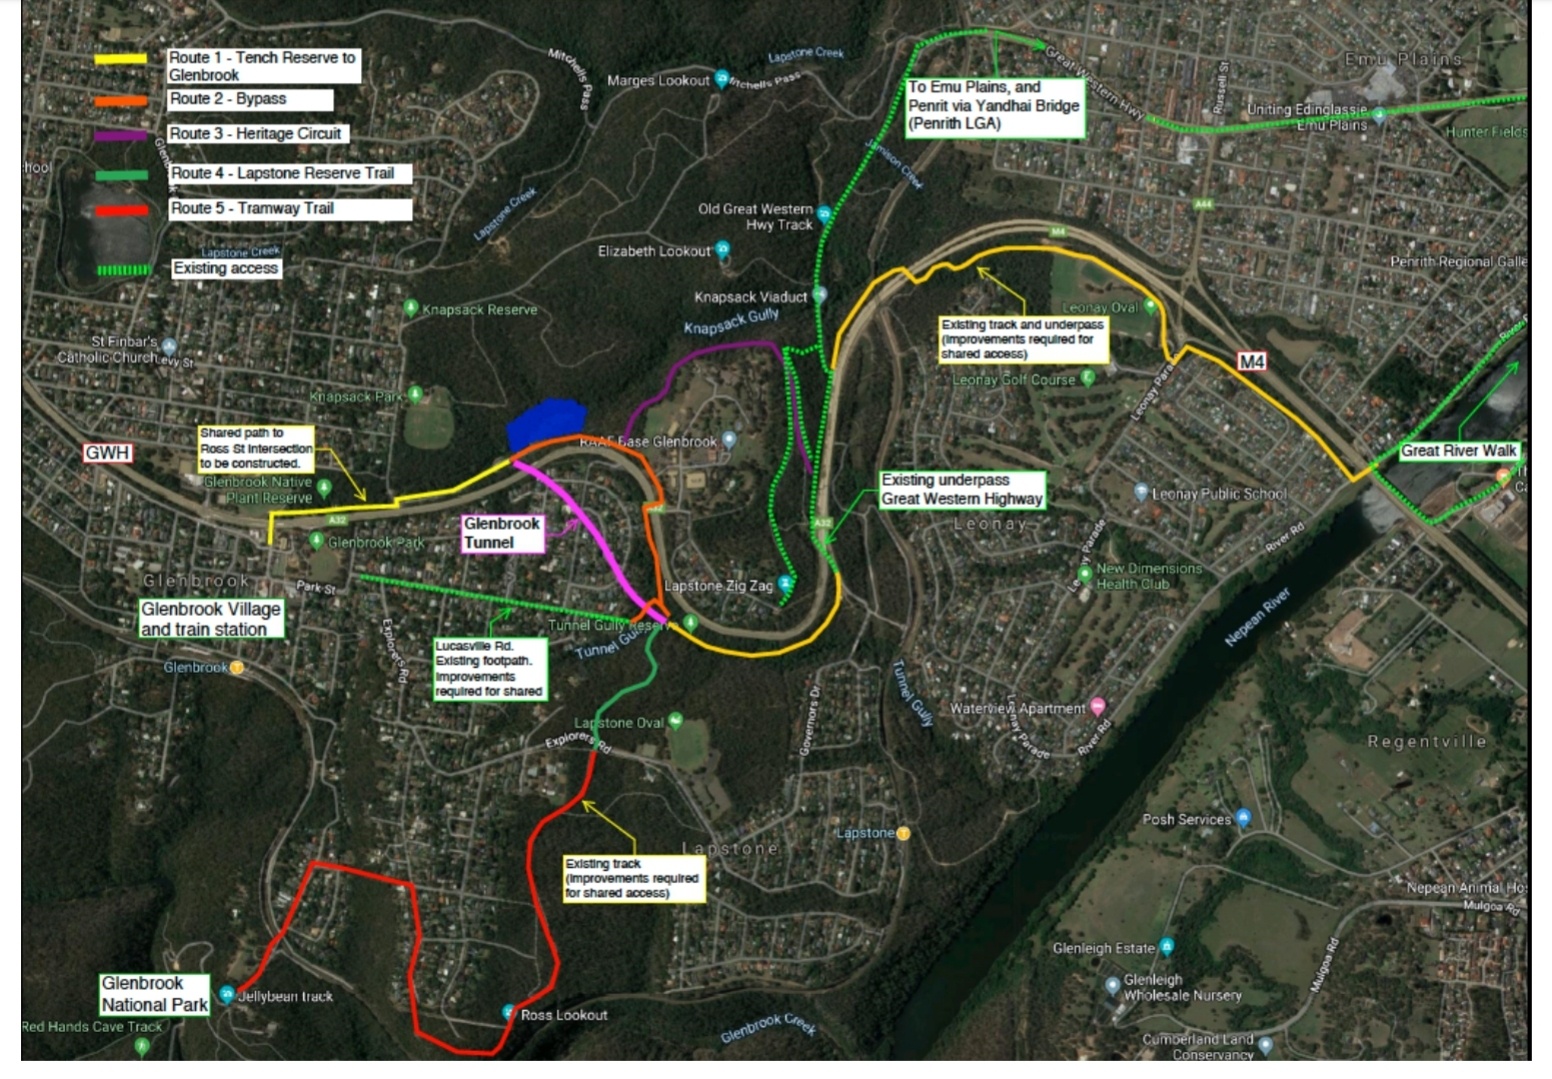
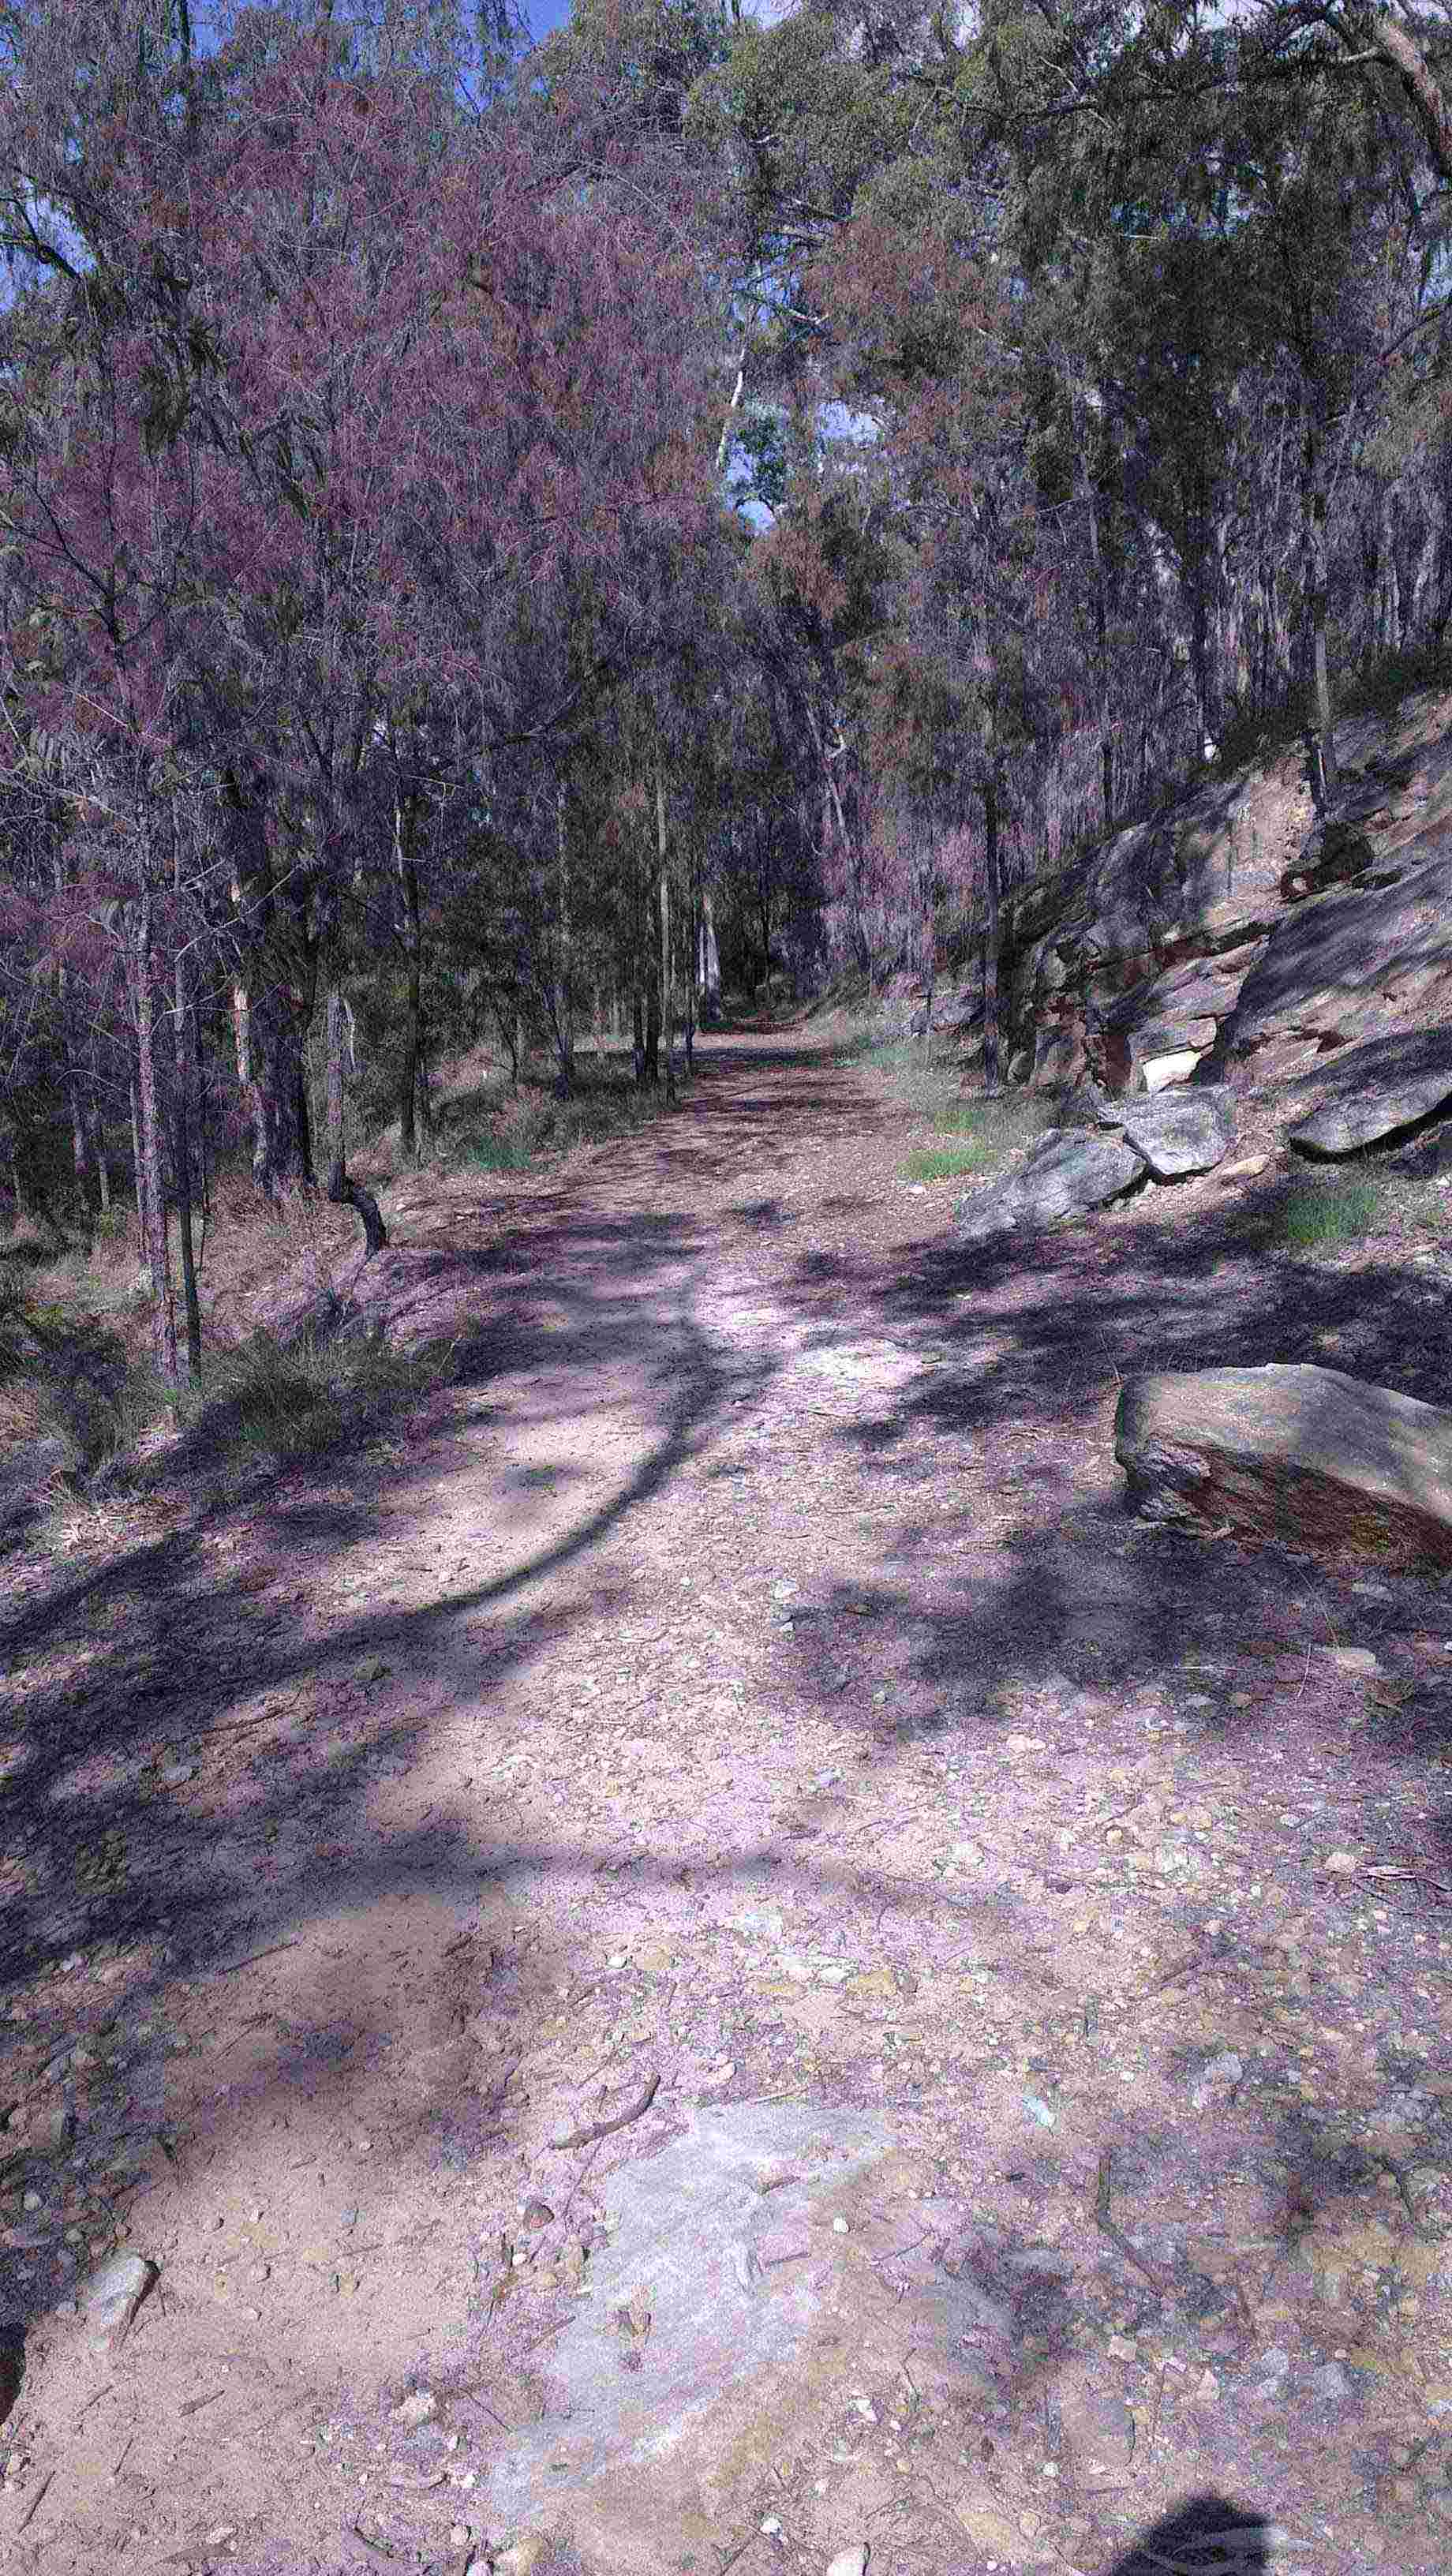
The Trail deteriorates into a dirt trail which is discontinuous and has 2 alternatives. The first is the Zig Zag which eventually leads to exit of the Glenbrook tunnel via Lucasville Station. The alternative possibility is to reopen the old Glenbrook tunnel.
<pstyle="text-align:center">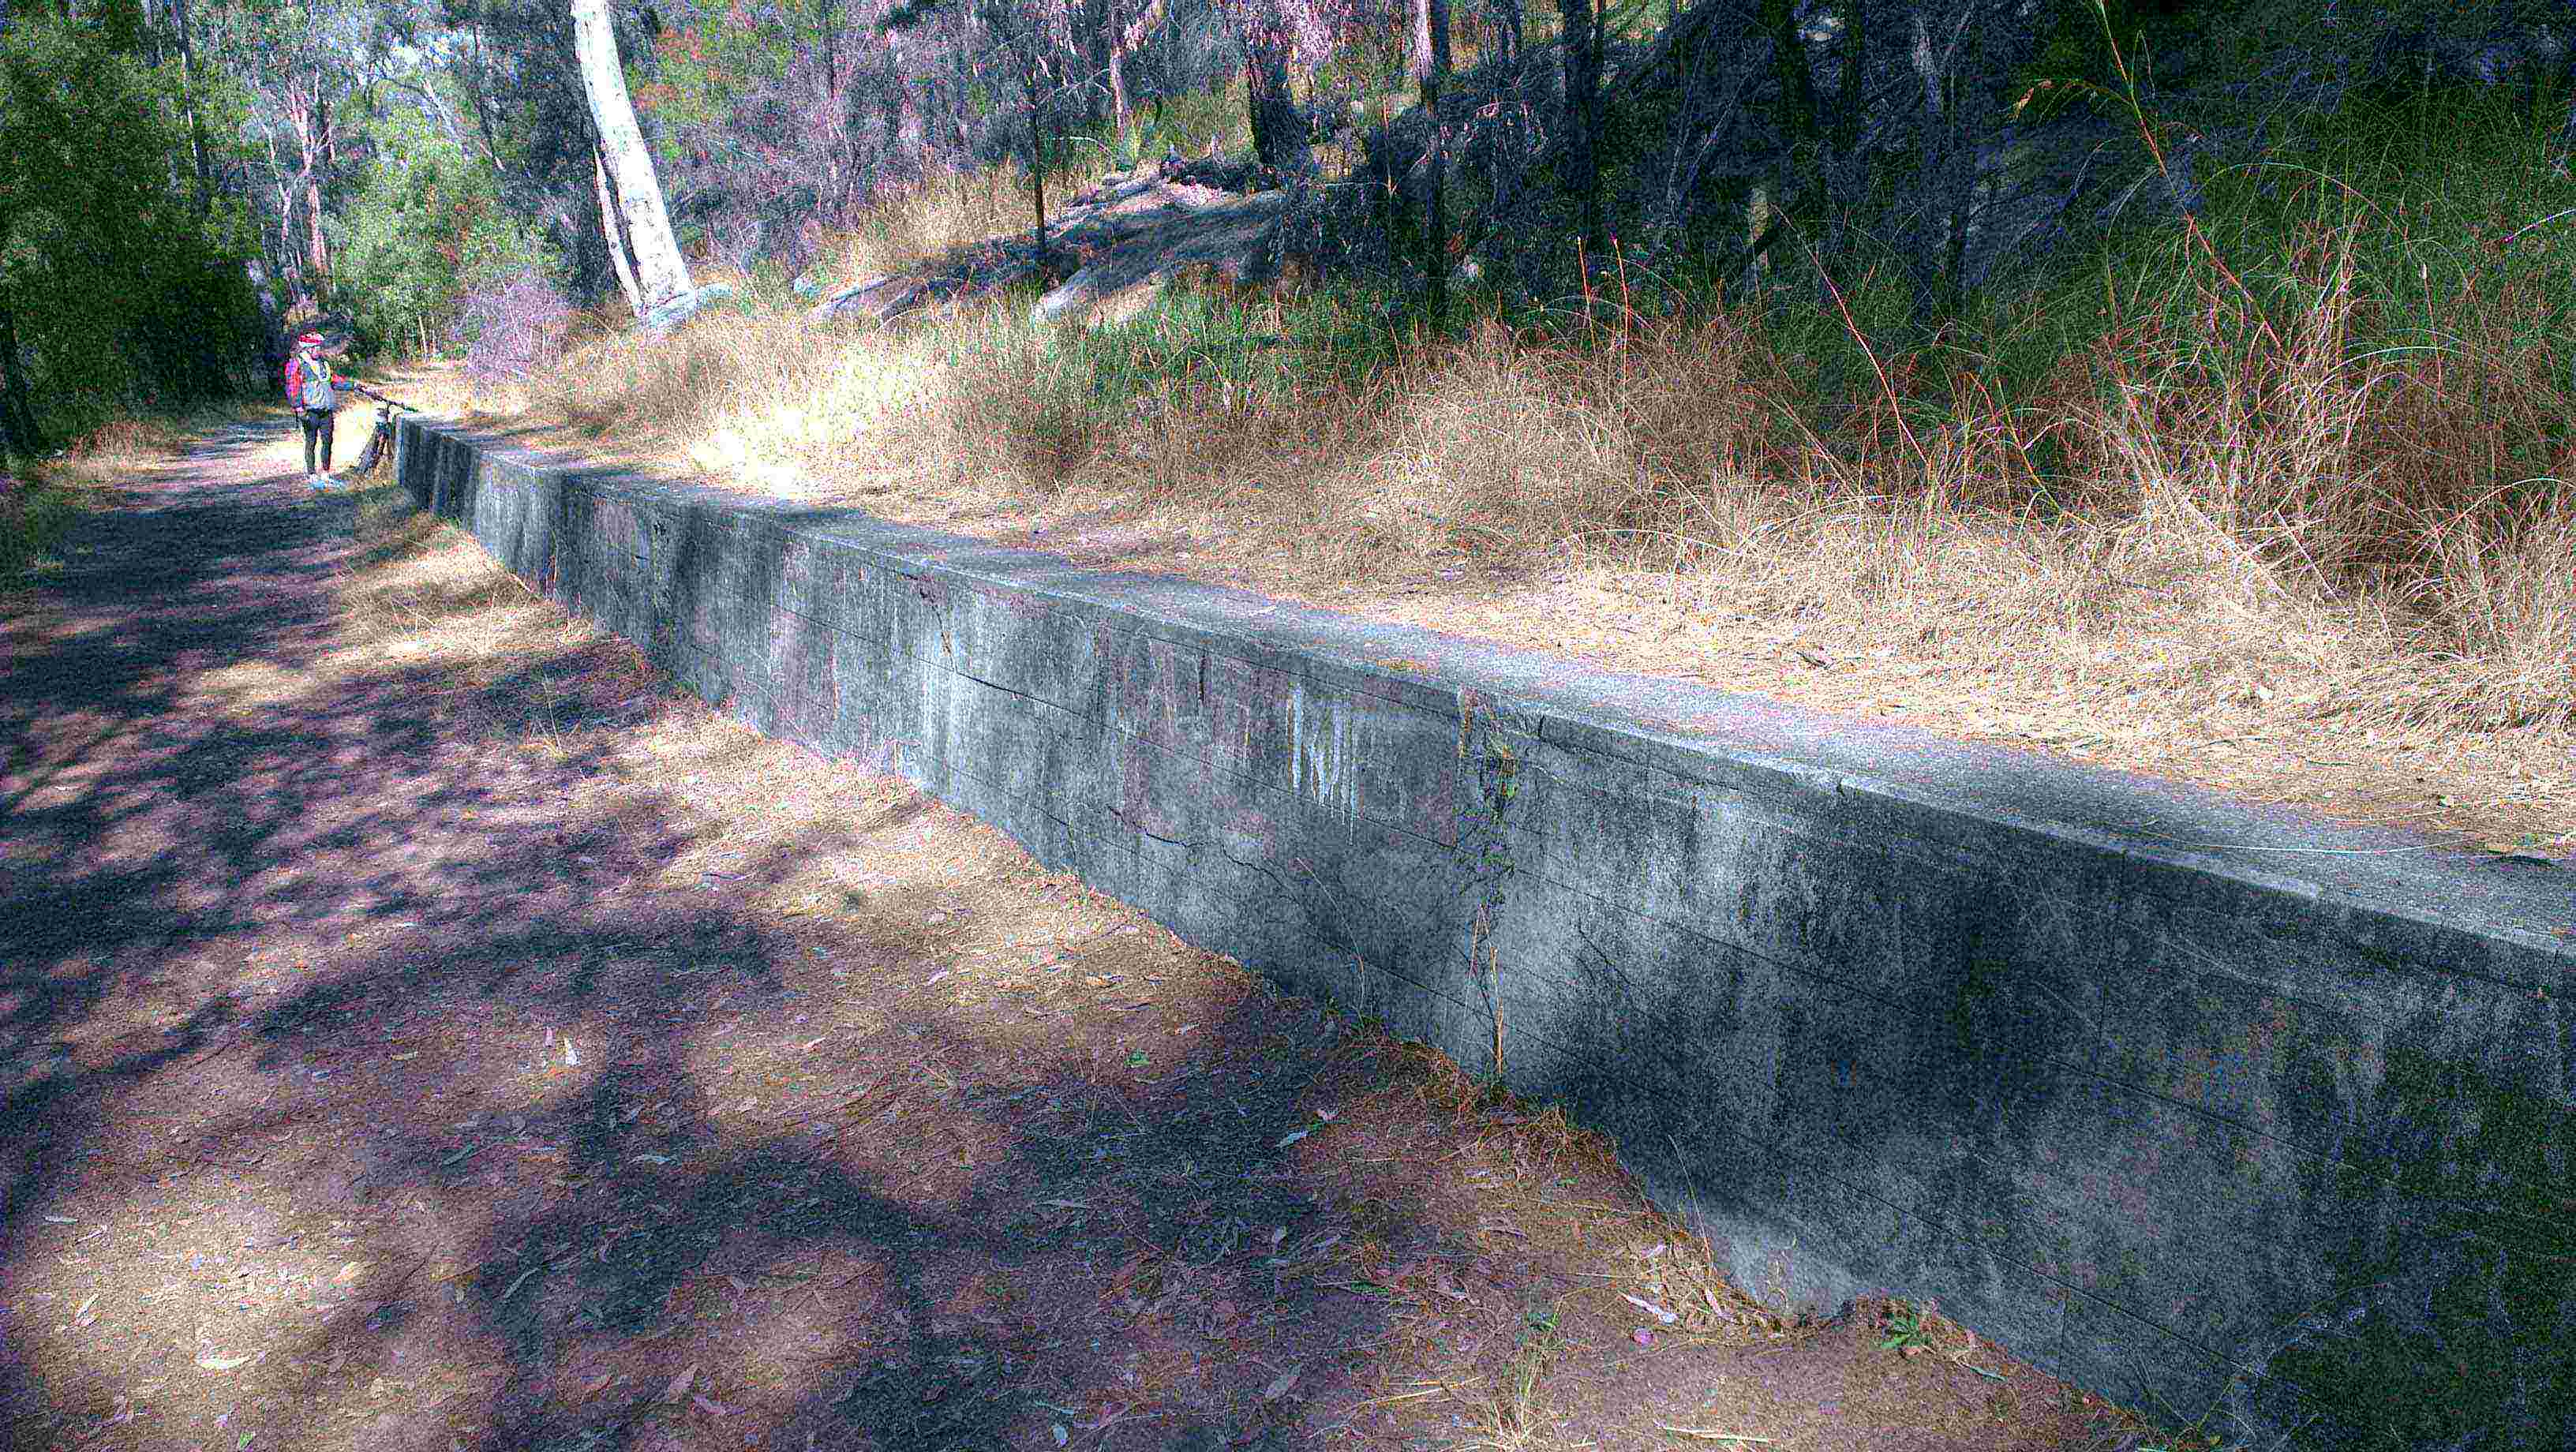
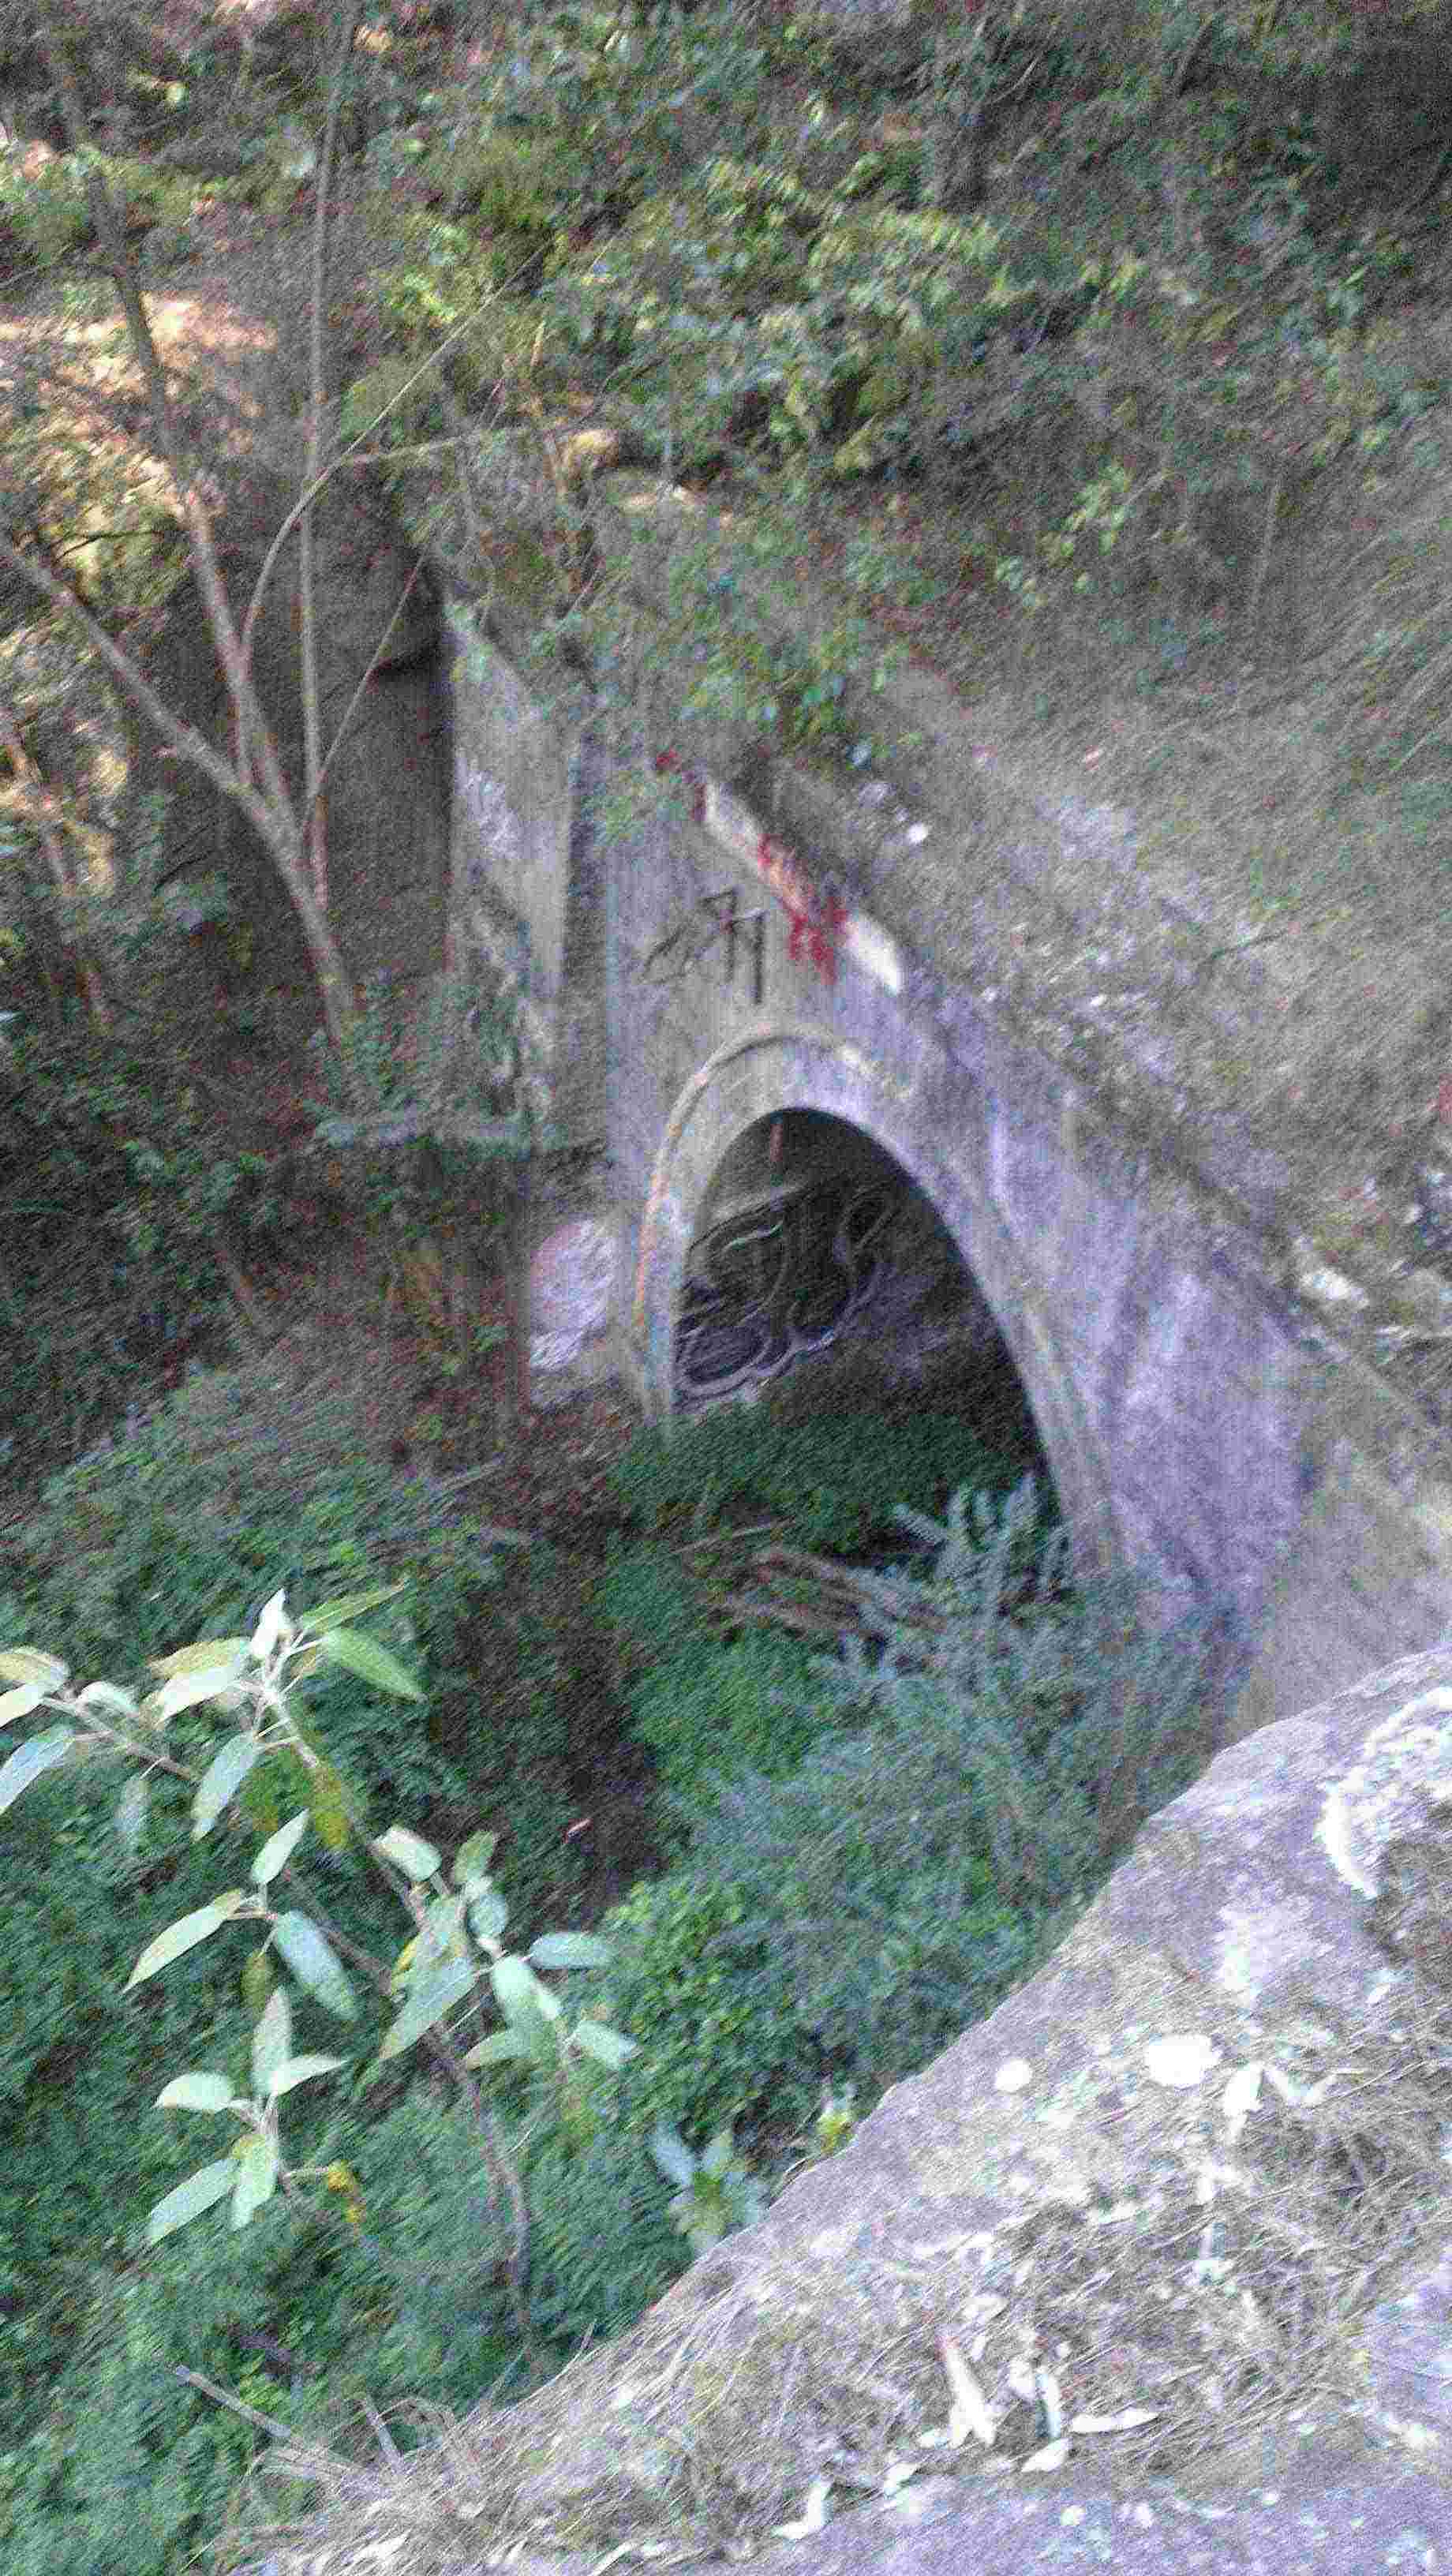
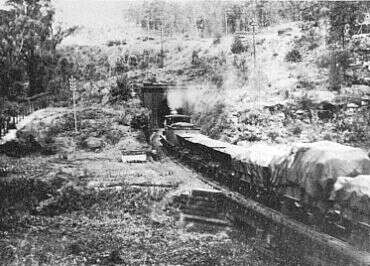
The 660.3m long Old Glenbrook Tunnel was built between April 1891 and December 1892 as part of a deviation which bypassed the Lapstone Zig Zag. To save money, a ventilation shaft was not included as it was believed the current of air passing through it would provide sufficient ventilation. This soon proved to be not the case. The gradient of the S-shaped single-line tunnel was, at 1 in 33, quite steep. Seepage kept the rails wet, leading to slipping and stalling. These shortcomings and the growing need for a second line led to the establishment of a new route through Glenbrook Gorge in 1913 which included a replacement tunnel.
https://www.facebook.com/glenbrooktunnel/
July 2021 : great news - Glennbrook tunnel to be reopened as a cycle trail
See article in Blue Mountains Gazette : https://www.bluemountainsgazette.com.au/story/7323551/historic-rail-tunnel-to-be-opened-to-community-following-new-funding-injection/
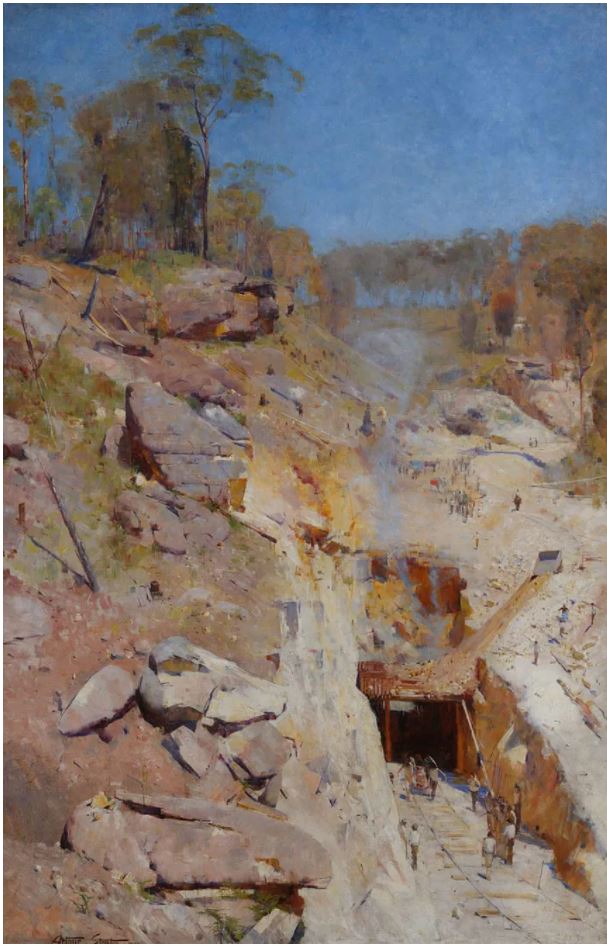
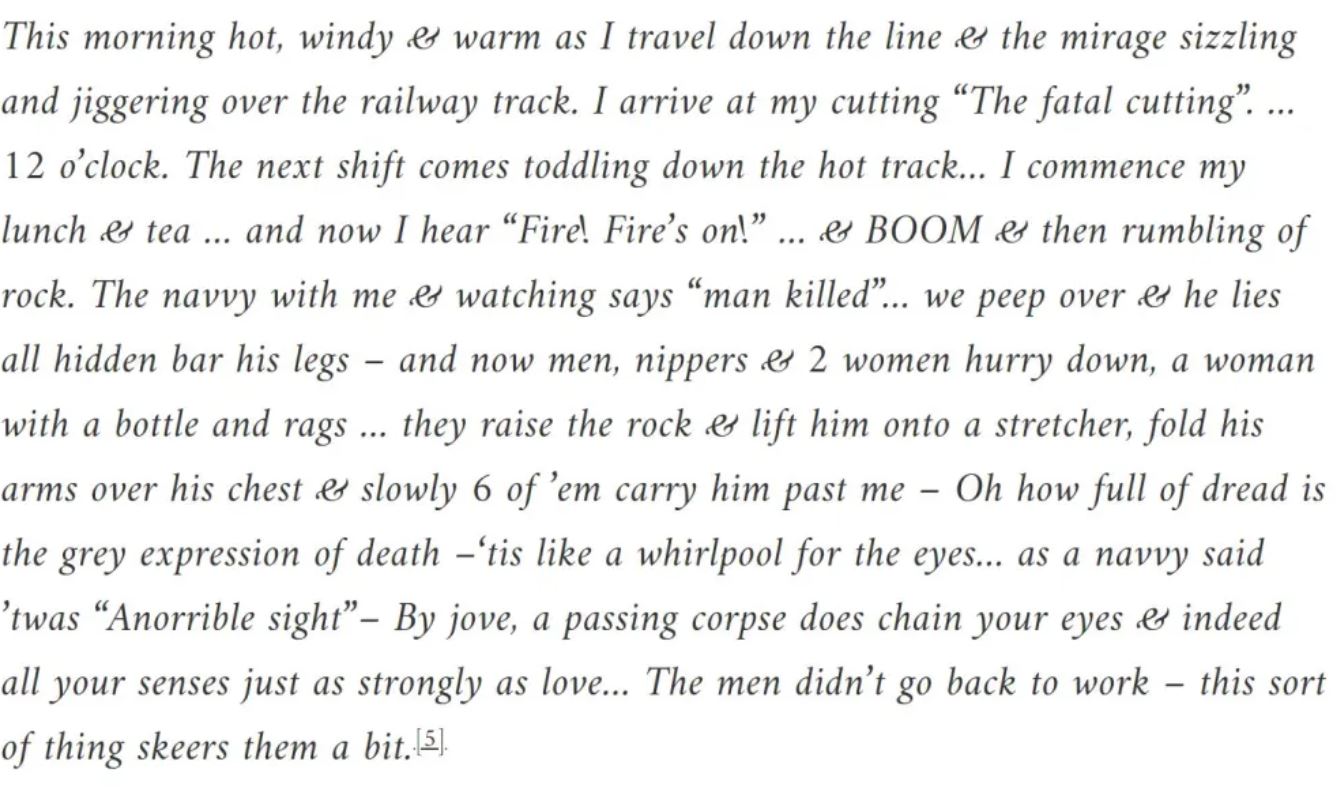
The most famous Arthur Streeton painting, 'fire's on', of the Glenbrook tunnel construction and the accident which claimed the life of a labourer.
In 1938 the painting was part of an exhibition at the National; Gallery. Lionel Lindsay interpreted it in this way;
‘….but the hero of this picture is not the poor fellow borne out by his mates, it is the Australian sunlight of a cloudless day, wide on the hillside.
Held down by the impenetrable blue of the sky, without chiaroscuro, and with only the crisp shadows of the sandstone to link his composition, Streeton has created a blaze of light on the broken hillside. By his gift of colour, by exactitude of values, and dexterity of touch, he has forced the yellows and bleached surfaces of earth upon a foil of warm-grey rocks, to yield a higher note of heat and light.’
Soon after completion the painting was purchased by the Art Gallery of New South Wales, where it is still held.
The tunnel was anything but a success. In 1913 it was closed and during WWII it was the sight of 'covered up' a gas tragedy. The gradient was too steep for trains and frequently passengers were asked to alight to reduce the load. Hopefully, soon it will be the gateway to the Blue Mountains cycling trails and will bring a sense of enjoyment and pride which unfortunately, the early settlers hadn't experienced. Hence, the mans death won't be in vain. Perhaps a plaque to all the workers should be erected there? I also think the cutting could have a climbing garden on one side of it.
8. Health
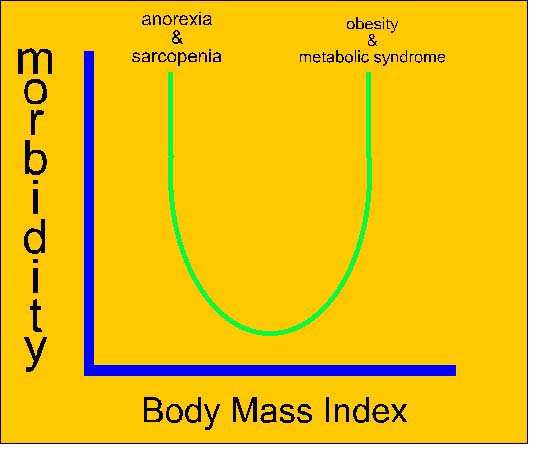
Unhealthy lifestyles, including poor nutrition, lack of exercise and stress have led to an epidemic of chronic illness commonly referred to as 'metabolic syndrome'. These illnesses include hypertension, hypercholesterol, heart disease, and diabetes frequently associated with weight gain and obesity. Depression and anxiety related disorders can also be impacted by a sedentary lifestyle and have been associated with either excessive weight loss (anorexia and sarcopenia) or gain. These illnesses have a high rate of morbidity that creates major economic and social burdens on society.
Diabetes
The Blue Mountains Eye Study examined 3654 residents aged 49 + years (82.4% response rate) during 1992–1994, and re-examined 2335 (75.1% of survivors) during 1997–1999 and 1952 (75.6% of survivors) during 2002–2004; 2123 participants with normal blood glucose levels at baseline were considered at risk of developing incident diabetes. The overall 10-year incidence of diabetes and IFG was 9.3% and 15.8%, respectively. Participants with metabolic syndrome at baseline had a higher risk of incident diabetes than those without metabolic syndrome (29.2% v 8.6%). Baseline factors associated with incident diabetes were elevated fasting glucose level (adjusted odds ratio [OR], 4.5; 95% CI, 3.4–6.1 per mmol/L), obesity (OR, 2.0; 95% CI, 1.3–2.8), diabetes family history (OR, 1.7; 95% CI, 1.2–2.5), current smoking (OR, 1.6; 95% CI, 1.0–2.7) and high density lipoprotein cholesterol level < 1.0 mmol/L (OR, 2.4; 95% CI, 1.5–3.8). Similar baseline factors were associated with incident IFG. They concluded that this population-based study provided data on the incidence of diabetes and IFG in an older, predominantly white population, and confirmed that metabolic and lifestyle factors are major risk factors for diabetes. (Cugati S et al 2007).
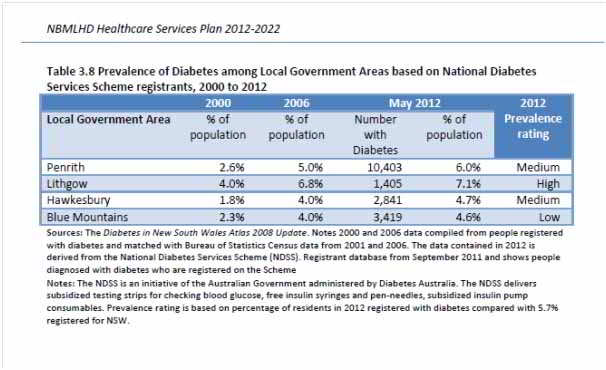
It is noteworthy, that the incidence of diabetes in the Blue Mountains appears to be low. This is in contrast to the feasibility study by Treadwell (2010) which claimed it was higher than average. This may be attributable to the generally more active lifestyle of the Upper Mountains residents? Regardless, the health of the surrounding areas may be impacted by a trans-mountains cycle trail bringing activity conscious healthy people into areas such as Lithgow and Penrith, as well as presenting cycling opportunities to these people.
Sarcopenia
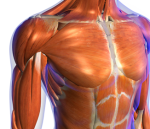
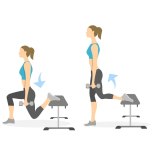
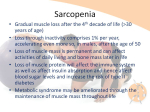
Sarcopenia is the gradual loss of muscle mass, commencing in the 4th decade of life. On average 1% muscle mass is lost irreversibly per year in muscles which are inactive. This accelerates after the 6th decade of life. The consequences are numerous, including reduced physical loading capacity and tolerance, reduced protein reservoir for the immune system and reduced capacity for the absorption of insulin. Frailty can lead to falls in the elderly, where hip fractures have a 25% morbidity rate and another 25% never leave some form of care. Regular (every 72hours) exercise can ameliorate the loss of muscle mass as well as provide an alternate metabolic pathway for the absorption of glucose through the use of Glut-4 receptors. Hence, the provision of a cycling trail on a gradient similar to a railway line would allow people to maintain their muscle mass through regular exercise.
Pollution
Pollution is known to cause respiratory distress. It is also known to increase the risk of artherosclerosis which can lead to stroke and heart disease. Provision of a cycling network may reduce congestion and pollution on the roads.
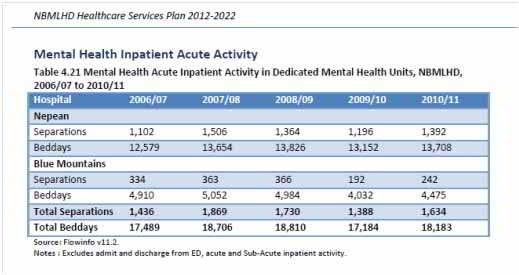
Mental Illness
The incidence of mental health issues are thought to be higher than the average (Treadwell 2010). Socialising and exercising have been shown to help reduce some mental health symptoms. The great aspect of cycling along a segregated trail, is the ability to enjoy a conversation whilst not worrying about being hit by speeding noisy traffic, thereby allowing the natural endorphins in the body to be released.
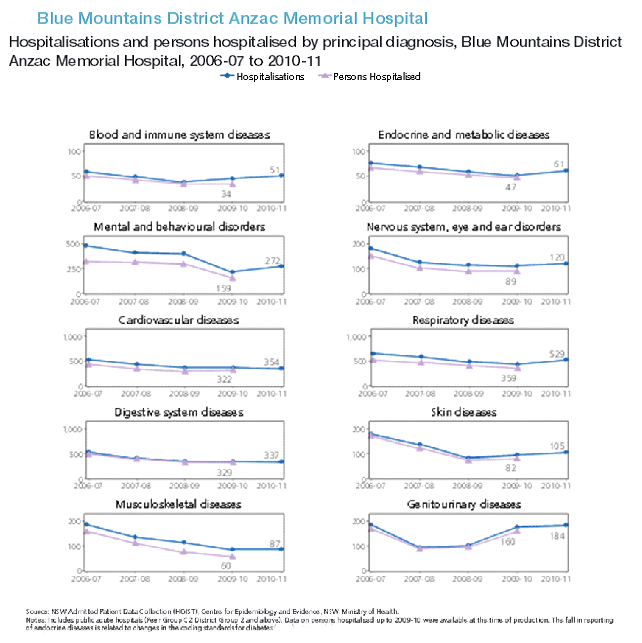
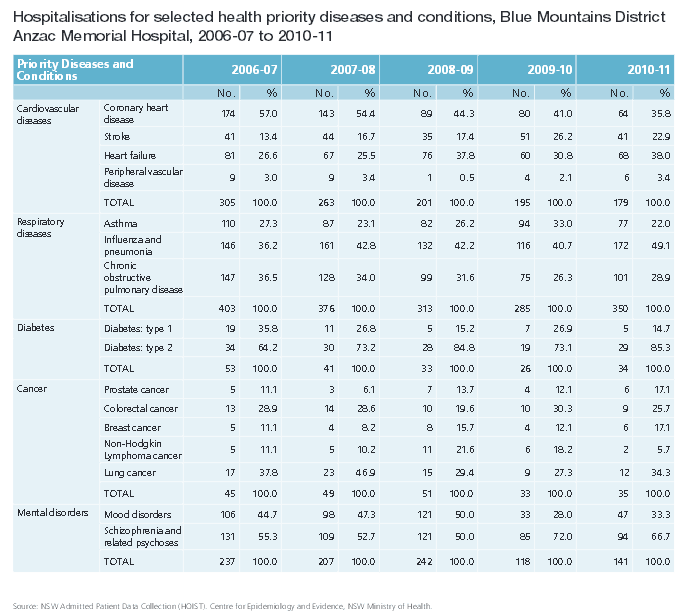
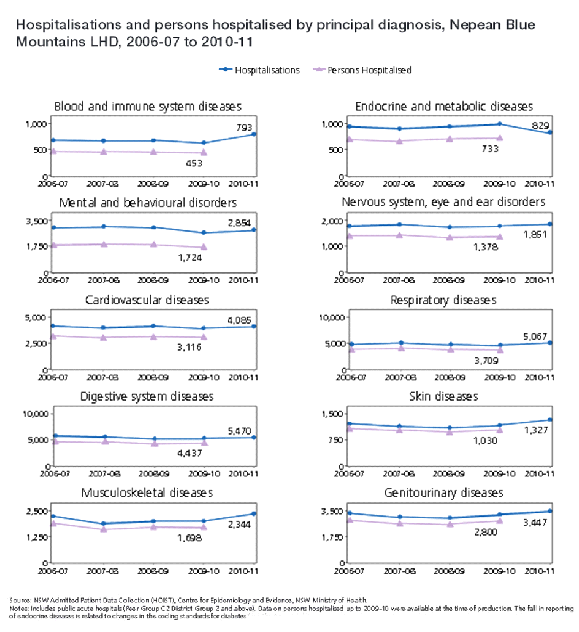
The rate of hospitalisation by diseases, which can be ameliorated by exercise, such as endocrine and metabolic diseases, cardiovascular diseases, and musculoskeletal diseases appears quite high. Reduction of these diseases, which represent a relative large economic health burden on society, through regular exercise, allows precious health dollars to be spent elsewhere.
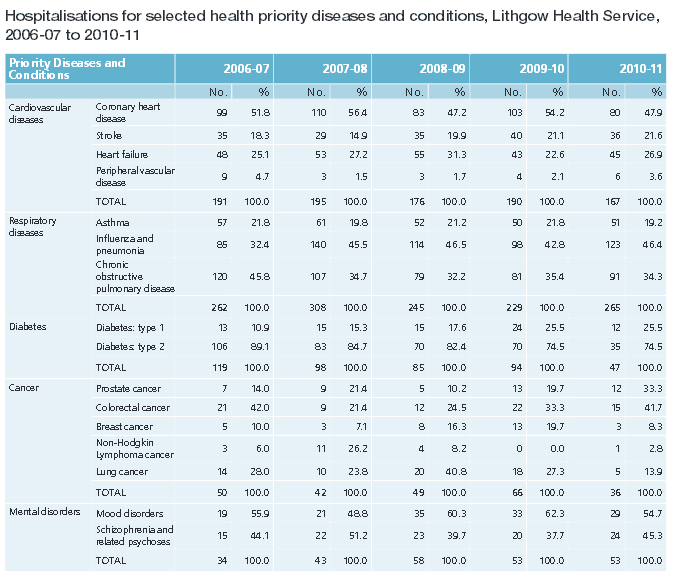
Musculoskeletal Disease
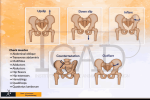
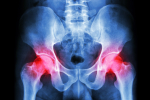
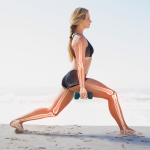
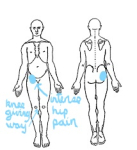
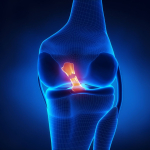
Musculoskeletal diseases such as knee and hip arthritis can quite frequently be helped through low impact low weight bearing exercise such as cycling because it aids joint lubrication, blood flow and prevents muscle atrophy, thereby maintaining joint stability. Cycling also can reduce the biomechanical loading on the joints through the burning of calories which leads to weight loss.
The severity of all these conditions can be reduced and better managed through regular endurance exercise such as cycling. Thus, investing in cycling infrastructure should reduce the economic health burdens on society.
The health and the environmental benefits of an active lifestyle are well documented (US Department of Health & Human Services 1996; Warburton 2006; Gotschi 2011). The growing levels of concern about increasing obesity, rising rates of chronic disease, climate change, and the environmental impact of continuing to rely on fossil fuels for transport have made the case for promoting physical activity across whole populations even more compelling (Guo & Gandavarapu 2010; Gotschi 2011; Gortmaker et al 2011). Walking and cycling for transport is one way with considerable potential to address a wide range of these costly health and environmental issues (MacMillan 2012)
According to Bauman et al (2008) the direct gross cost of physical inactivity to the Australian health budget in 2006/2007 was around $1.49 billion. Other Australian studies have reported that insufficient physical activity was the third largest single determinant on the Burden of Disease Scale in Queensland (Fishman et al (2011) and that inactivity was costing Australia $13.8 billion, traffic congestion a further $13 billion and car trips another $9.6 billion in air, water and noise pollution (Australian Bicycle Council 2011).
By increasing peoples physical activity, cycling can help to reduce pressure on health services. Globally, physical inactivity is estimated to cause two million deaths each year, representing between 10 and 16% of cases of breast cancer, colon cancers, and diabetes, and over 20% of heart disease cases (World Health Organisation: Information sheet on physical activity, http://www.who.int/dietphysicalactivity/media/en/gsfs_pa.pdf). The scene in Australia is similar, with approximately 16,000 deaths each year attributable to physical inactivity (Medibank Private (October 2008) The cost of physical inactivity). In 2007-08, 72% of Australians aged 15 years and over were classified as sedentary or having low exercise levels. Of these, just under half (49%) recorded no or very little exercise in the previous two weeks (sedentary exercise level) and 51% recorded a low level of exercise. Inactivity and obesity are linked, and in 2007/08 one quarter, or 600,000, of all Australian children aged 5-17 years were overweight or obese (Australian Bureau of Statistics (2009): Australian Social Trend – Children who are overweight or obese Cat. no 4102.0). This figure is even higher among adults – up to 61% are overweight or obese (Australian Bureau of Statistics: National Health Survey: Summary of Results 2007-08 Cat. No 4364). As well as helping to address overweight and obesity, regular physical activity can reduce the risk of cardiovascular disease, type 2 diabetes and some forms of cancer. It can also improve mental wellbeing by reducing feelings of stress, anxiety and depression. (Australian Institute of Health and Welfare: Australia‟s Health 2006, AIHW Catalogue AUS73). The latter is particularly pertinent to the Katoomba region where higher levels of mental illness have been noted. (Treadwell 2010)
The health and environmental effects of reliance on car travel are linked (Swinburn et al 2011). Apart from the physical effects from inactivity, death and injury, and respiratory conditions linked to air pollution, there are a range of well documented effects on mental health and general wellbeing. Road traffic noise annoyance, traffic congestion and long commuting times contribute to stress, depression and anxiety, as do the opportunity costs of the time taken getting from one place to another (Dratva et al 2010; Ogilvie et al 2007; Frumkin 2002).
Policies that are likely to be most effective in mitigating the effects of road transport on climate change are also likely to be effective in addressing the range of impacts on physical and mental health (Woodcock et al 2009; Macmillan 2010; Haines et al 2007). Moreover, changing the built environment to encourage active transport options is known to reach population groups less likely to participate in leisure time physical activity (Fishman et al 2011). Investing in infrastructure that changes the built environment to make cycling and walking to every-day destinations like work and school convenient and safe has been shown to offset the health costs of sedentary lifestyles and to be more effective than individual behavioural interventions (Macmillan 2012, p. 33-34). There is evidence that such investment also provides a wide range of direct and indirect environmental, social, amenity and economic benefits (Gotschi 2011; Mackie 2010; Wu et al 2011; Turner et al 2011; Cycle to Work Alliance 2011; Guo & Gandavarapu 2010). A recent health impact assessment that investigated policies to reduce vehicle miles travelled in Oregon (Perdue et al 2012) similarly found that the most effective policies – limiting sprawl, increasing connectivity, and creating infrastructure for pedestrians and cyclists - had a consistent association with health benefits, particularly increased physical activity and decreased air pollution.
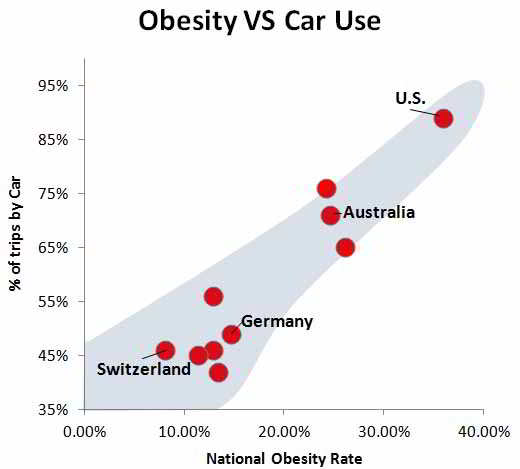
Although there are many ways to be physically active, walking and cycling are among the most practical and effective, particularly for inactive and overweight people (Sevick, et al. 2000; Pucher and Beuhler 2010; Bassett, et al. 2011). The U.S. Center for Disease Control's Healthy People 2020 program includes specific objectives to increase walking and cycling (www.healthypeople.gov, PAF 10 and PAF 11). Residents of more multi-modal communities exercise more and are less likely to be overweight than in automobile-oriented communities (Ewing, Schieber and Zegeer 2003; Frank 2004). Analysis of 11,041 high-school students in 154 U.S. communities found that their odds of being overweight or obese decreased if they lived in more walkable communities (Slater, et al. 2013). Increased walking appears to reduce long-term cognitive decline and dementia (Erickson, et al. 2010).
A major ten-year study found that the overall health of residents of new housing developments improved when their daily walking increased as a result of more access to parks, public transport, shops and services (Giles-Corti, et al. 2013). Rojas-Rueda, et al. (2011) quantified the overall health impacts to users from shifting urban driving to cycling, including changes in accident risk, pollution exposure and public fitness. The study concluded that Barcelona's Bicing public bike rental system causes 0.03 additional annual traffic accident deaths, 0.13 additional air pollution deaths, and 12.46 fewer deaths from improved fitness, resulting in 12.28 deaths avoided and a 77 benefit:risk ratio. This does not account for the additional health benefits from reduced accident risk and reduced air pollution exposure to other residents. The authors conclude that public bicycle sharing schemes can help improve public health and provide other benefits.
Grabow, et al. (2011) estimated changes in health benefits and monetary costs if 50% of short trips were made by bicycle during summer months in typical Midwestern U.S. communities. Across the study region of approximately 31.3 million people, mortality is projected to decline by approximately 1,100 annual deaths. The combined benefits of improved air quality and physical fitness are estimated to exceed $7 billion/year. These findings suggest that significant health and economic benefits are possible if bicycling replaces short car trips.
Rabl and de Nazelle (2012) estimate the health impacts caused by shifts from car to bicycling or walking, considering four effects: changes in physical fitness and ambient air pollution exposure to users, reduced pollution to other road users, and changes in accident risk. Switching from driving to bicycling for a 5 km one-way commute 230 annual days provides physical activity health benefits worth 1,300 € annually and air emission reduction worth 30 €/yr. overall. The commuter that switches mode bears additional air pollution costs averaging 20 €/yr, but this impact depends on cycling conditions; cyclists' pollution exposure can be reduced if they ride separated from major roadways. Data from Paris and Amsterdam imply that any increase in accident risk is at least an order of magnitude smaller than physical activity health benefit.
Evaluation methods: Some studies monetize the health benefits of improved walking and cycling ("Safety and Health," Litman 2009; Boarnet, Greenwald and McMillan 2008; SQW 2007; Cavill, et al. 2008; NZTA 2010). Cavill, Cope and Kennedy (2009) estimated that an integrated program that increases walking in British towns provides benefits worth £2.59 for each £1.00 spent, considering just reduced mortality. Including other benefits (reduced morbidity, congestion and pollution) would increase this value. The Department for Transport found even higher economic returns (DfT 2010). The Active Transport Quantification Tool (ICLEI 2007) and the Health Economic Assessment Tool for Cycling and Walking (WHO 2011) provide methodologies for valuing the active transportation benefits, including savings from avoided driving, increased happiness, and reductions in coronary heart disease, diabetes risk, congestion, pollution and crash risk.
Guo and Gandavarapu (2010) conclude that the incremental costs of residential sidewalk construction are usually repaid by the health benefits of increased physical fitness and reduced vehicle air pollution. They estimate that building sidewalks on all city streets would increase average daily active travel 0.097 miles and reduce automobile travel 1.142 vehicle-miles per capita. The increased walking and cycling provide 15 kcal/day per capita in average additional physical activity, predicted to offset weight gain in about 37% of residents, providing substantial healthcare cost savings.
Gotschi (2011) estimated that Portland, Oregon's 40-year $138-605 million bicycle facility investments provide $388-594 million healthcare savings, $143-218 million fuel savings, and $7-12 billion in longevity value, resulting in positive net benefits. Sælensminde (2002) estimates that each physically inactive person who starts bicycle commuting provides €3,000-4,000 annual economic benefits. Meta-analysis by de Hartog et al. (2010) indicates that people who shift from driving to bicycling enjoy substantial health benefits (3 to 14 month longevity gains), plus additional benefits from reduced air pollution and crash risk to other road users.
One of the great benefits with our proposal is that it allows the combination of dual mode transport, such as ride commuting from one of the Upper Mountains towns to Katoomba and catching one of the more frequent trains from there. For the recreational cyclist it allows riding one way and catching the train back from the end destination.
"NSW 2021 emphasises that an integrated transport system is needed to ensure different transport modes work together and that the interests of transport users are primary. Within the NSW 2021 plan, the NSW Government has identified as a priority action the need to improve and coordinate existing transport services by defining projects needed for growth, improving the way people travel and how businesses move goods to metropolitan and regional communities". http://www.parliament.nsw.gov.au/prod/parlment/committee.nsf/0/4b498c014907c7b9ca257abe001b844a/$FILE/Utilisation%20of%20rail%20corridors%20report%201-55.pdf
Therefore, there are several health benefits by investing in a cycling trail in the Upper Blue Mountains which can have economic consequences through reduced hospital and doctor visits from improved well-being not only in the Blue Mountains but also the greater Sydney community which it can serve through recreational facilities.
9. Role of Government Departments (Rail Corp and Ministry for Transport)
On 15 May 2012 the Minister for Transport, the Hon Gladys Berejiklian MP, announced that Rail Corp would be broken up into two specialised organisations to service the different needs of Sydney and intercity/regional train customers. The Minister also stated that previous functions of Rail Corp, including construction and major projects, would be transferred to Transport for NSW, to ensure that Rail Corp and subsequently Sydney Trains and NSW Trains are able to focus solely on providing customer services. The Department of Planning and Infrastructure is responsible for 'long term planning for regions across NSW, driving well located housing and employment, assessing State significant development proposals, and ensuring that the NSW planning system is efficient and effective'. The role of the Department is to deliver strategies and decisions to encourage sustainable growth and employment in NSW, strategies which include transport related planning.
In terms of the overall benefits of such development, Transport for NSW (2012) submitted that well designed development of land adjacent to rail corridors, in order to integrate transport with land use, would create a more liveable and accessible city:
"One of the Government's goals is a greater proportion of travel by public transport, walking and cycling. This means population growth in Sydney needs to be planned for places that encourage these modes of transport, especially for commuter trips. New housing, shops and services should be located to link with the transport system and, consistent with the Government's objectives, with jobs located closer to where people live. This approach benefit people and the economy, by creating a liveable city, with more accessible jobs and a transport system that moves people and goods efficiently."
"Rail corridors present major opportunities for active transport (cycling and walking), due to their width, strong direct links to key centres, employment, schools and services as well as gentle grades / topography. These characteristics make them fundamental to creating a more compact city built around the principles of Transit Orientated Development. Active transport can complement the rich mix of land use development enabling many short trips to be undertaken without the need for a motor car, significantly reducing traffic congestion and car dependency, as well as greatly improving public health, community cohesion and interaction. The benefits and opportunities to the community of incorporating a shared cycleway along the rail corridor for active transport was confirmed in a report prepared for the RTA and Sutherland Shire Council by GTA in 2010. It showed that various sections of the rail corridor situated outside of the rail operational safety zone are suitable to accommodate active transport uses"
Similar to our experience, dealing with Rail Corp since 1998, the COMMITTEE ON TRANSPORT AND INFRASTRUCTURE BARRIERS FOR RAIL CORRIDOR PROJECTS (2012) found that many submissions by various councils expressed their experiences, of extreme difficulty when dealing with Rail Corp, in trying to develop their cycling infrastructure projects around rail corridors. Blue Mountains City Council (BMCC) has also met an impasse when trying to negotiate the construction of the cycle trail, along the rail corridor, between Blackheath and Mt Victoria (2009 and 2013). Hopefully, now that these construction functions of Rail Corp have been transferred to the Ministry of Transport, further delays in the construction of the Trail beside Rail will be minimised.
10. Economic considerations
Improved walking and cycling conditions can increase local property values and support local development (Bartholomew and Ewing 2011; Cortright 2009; Krizek et al. 2006; LGC 2001), an indication of the value that residents and customers place on these qualities, and increased economic productivity (Pivo and Fisher 2010; Buchanan 2007). Property values also tend to increase with proximity to public trails (NTTP 2005; Karadeniz 2008; Racca and Dhanju 2006). Retailers sometimes oppose non-motorized improvements, such bike lanes, based on the assumption that motorists are better customers than pedestrians and cyclists, but this is often untrue (Clifton, et al. 2012 and 2013; Fleming, Turner and Tarjomi 2013; Rowe 2013; Stantec 2011; Sztabinski 2009; TA 2006). Bicycle parking is space efficient and so generates about five times as much spending per square meter as car parking (Lee and March 2010).
Although automobile and fuel production are major domestic industries, a large portion of these products are imported. Since they are capital intensive with relatively little labor input, overall national employment and business activity increase as consumers shift.
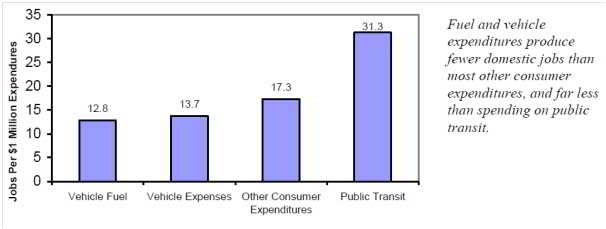
As a result, reducing vehicle and fuel spending tends to support economic development. Because non-motorized facility construction is relatively labor intensive it tends to create more employment and regional business activity than other capital projects. For example, analysis by Garrett-Peltier (2010) found that a $1 million spent on bike lanes directly creates 11.0 to 14.4 jobs, compared with approximately 7.0 jobs created by the same expenditure on roadway projects.
Employment and Tourism
The Blue Mountains is a world renowned tourist destination with iconic landmarks which are easily recognisable around the world. In fact it is a city within a World Heritage Listed Area. The major employment in the upper Blue Mountains is tourism and welfare. A problem which the Blue Mountains clearly faces is an iconic tourist destination which isn't contributing as much to the economy as it should be. This is demonstrated in the following tables where it can be seen that Blue Mountains share of visitors and their economic contribution has either remained stagnant or has dwindled in the past decade. In fact the Blue Mountains is 12th or second last in the contribution of tourism to the local economy when comparing other regions of NSW.
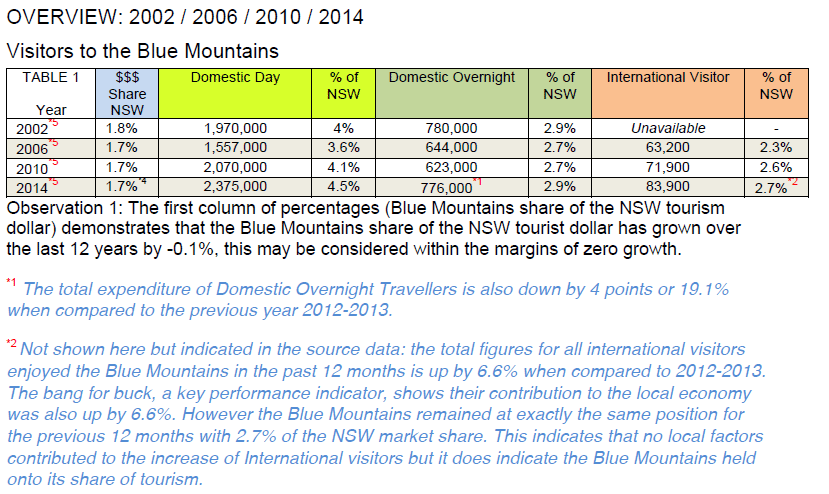
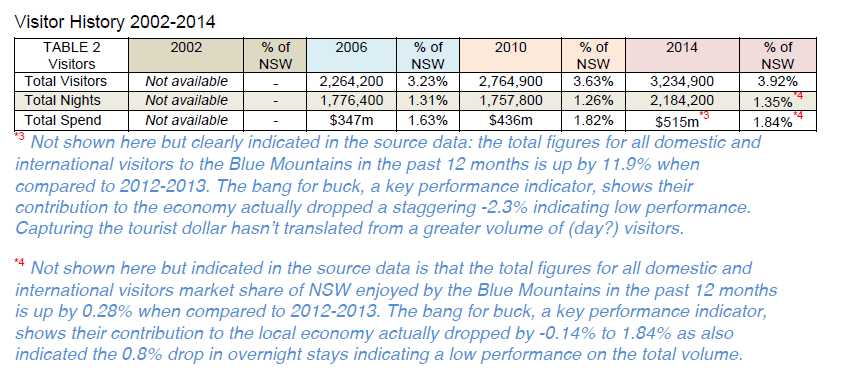

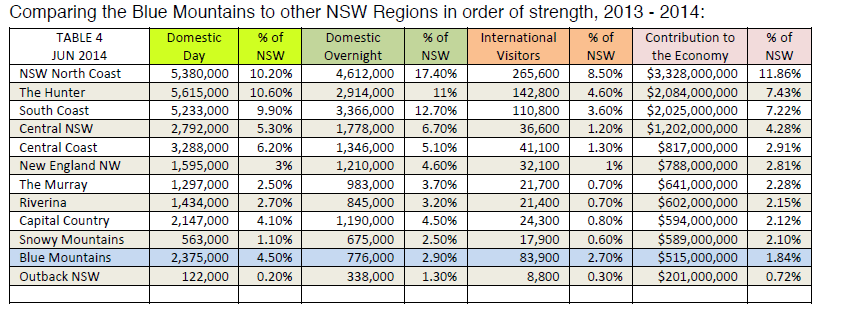
A study in the United States (Garrett-Peltier 2011) looked at the employment benefits that could accrue from investing in walking and cycling infrastructure. The analysis took into account the jobs that were created in all the phases of design and construction of facilities including the manufacturing of materials and equipment. They also noted that the facilities once built would bring significant benefits to individual communities. Details from 58 walking or cycling trail projects from eleven cities throughout the United States for which adequate data could be obtained were analysed. Job creation was assessed in terms of the number of full time equivalent positions created for each $1 million spent. Across all projects the average level of job creation was around nine jobs, with cycling infrastructure projects creating the most (11.4 jobs per million spend) and roading-only projects such as repaving or widening roads the least (7.8 jobs per million spent). The study concluded that when planners are "… confronted with a decision of whether or not to include pedestrian and/or bicycle facilities in transportation infrastructure projects, [they] should do so, not only because of the environmental, safety, and health benefits but also because these projects can create local jobs." (p. 9).
The study did not take account of revenues and jobs for local bike shops and other businesses, employment in maintenance of the facilities, or tourism benefits for cycling and walking trails outside urban areas. These have been considered elsewhere. Snyder (undated), for example, listed economic benefits to local businesses from eight different studies of walking and cycling investments in the United States which showed potential benefits in areas such as increased sales tax as visitors were likely to spend on food, lodging, clothing, equipment, and accessories, while the government would benefit from the increased sales tax. Additionally, businesses and properties in areas adjacent to such facilities were likely to rise in value. Similarly a recent report from the Australian Bicycle Council (2011) noted that the Australian bicycle industry employs 10,000 people and generates $139 million annual income tax revenue, that bikes and accessories are worth $1 billion a year, generating $100 million GST revenue, and that cycle events and tourist trails generate $254 million a year.
The Murray to the Mountains Rail Trail in Victoria alone injects an estimated $1 000 000 into the local economy through tourism. It is 98km in length and was a feature article in the Australian Geographic during 2004. La Trobe University Associate Professor Sue Beeton has released the results of a further study into the economic effects of Regional Communities and Cycling. Results indicated that in 2006 the average cyclist spends a total of $258.- per person per day ! This is up from $203.- in 2003. Additionally, it was found that the 8300 Easter visitors alone contributed $2,141,400 to the local community. This represented 21.6 F/T jobs being created by the Easter visitations.
Similarly, the Otago Rail Trail in New Zealand demonstrated major and significant positive economic impacts to local business and hence employment. One quarter of businesses interviewed stated that they had set-up since 2001 due to the Rail Trail. 68% of businesses stated that 20% of their income was directly related to the Rail Trail. The results are simply stunning and the trail should be viewed at http://www.atoz-nz.com/railtrail.asp
Please see below for case studies of the impact of active transport tourism both within Australia and Overseas.
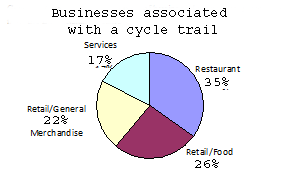
Citations
• Australian Bicycle Council and Cycling Promotion Fund. 2011. Australian cycling: an economic overview. Fact sheet. Available: http://www.cyclingpromotion.com.au/content/view/551/9/ Accessed 29.5.12.
• Bartholomew K and Ewing R (2011), "Hedonic Price Effects of Pedestrian- and Transit-Designed Development," Journal of Planning Literature; at http://faculty.arch.utah.edu/bartholomew/Individual%20Files/12_Hedonic_Price_Effects.pdf
• Buchanan C (2007), Paved With Gold, Commission for Architecture and the Built Environment (www.cabe.org.uk); at www.cabe.org.uk/files/paved-with-gold-summary.pdf
• Clifton KJ, et al. (2012), Consumer Behavior And Travel Mode Choices, Oregon Transportation Research and Education Consortium (www.otrec.us); at http://kellyjclifton.com/Research/EconImpactsofBicycling/OTRECReport-ConsBehavTravelChoices_Nov2012.pdf
• Clifton KJ, et al. (2013), Examining Consumer Behavior And Travel Choices, Oregon Transportation Research and Education Consortium (www.otrec.us); at http://otrec.us/main/document.php?doc_id=1250
• CNU (2009), San Francisco's Octavia, Congress for New Urbanism (www.cnu.org); at www.cnu.org/highways/sfoctavia.
• Cortright J (2007), Portland's Green Dividend, CEOs for Cities (www.ceosforcities.org); at www.ceosforcities.org/files/PGD%20FINAL.pdf
• Cortright J (2009), Walking the Walk: How Walkability Raises Home Values in U.S. Cities, CEOs for Cities (www.ceosforcities.org); at www.ceosforcities.org/files/WalkingTheWalk_CEOsforCities1.pdf
• Fleming T (Allatt), Turner S and Tarjomi L (2013), Reallocation of Road Space, Research Report 530, NZ Transport Agency (www.nzta.govt.nz); at www.nzta.govt.nz/resources/research/reports/530/docs/RR-530-Reallocation-of-road-space.pdf
• Forsyth A, Krizek KJ and Weinstein Agrawal A (2010), Measuring Walking and Cycling Using the PABS (Pedestrian and Bicycling Survey) Approach: A Low-Cost Survey Method for Local Communities, Mineta Transportation Institute, San Jose State University (www.transweb.sjsu.edu); at www.transweb.sjsu.edu/project/2907.html
• Garrett-Peltier H (2010), Estimating The Employment Impacts Of Pedestrian, Bicycle, And Road Infrastructure: Case Study: Baltimore, Political Economy Research Institute University of Massachusetts, Bike League (www.bikeleague.org); at www.bikeleague.org/resources/reports/pdfs/baltimore_Dec20.pdf
• Karadeniz D (2008), Impact of the Little Miami Scenic Trail on Single Family Residential Property Values, Masters Thesis, University of Cincinnati, (http://atfiles.org/files/pdf/LittleMiamiPropValue.pdf).
• Krizek KJ (2006), "Two Approaches to Valuing Some of Bicycle Facilities' Presumed Benefits," Journal of the American Planning Association, Vol. 72. No. 3, Summer, pp. 309-319; at http://carbon.ucdenver.edu/~kkrizek/pdfs/Two%20approaches%20valuing%20bike.pdf
• Krizek KJ, et al. (2006), Guidelines for Analysis of Investments in Bicycle Facilities, NCHRP Report 552, TRB (www.trb.org); at http://onlinepubs.trb.org/onlinepubs/nchrp/nchrp_rpt_552.pdf
• Krizek KJ, Barnes G, Wilson R, Johns B and McGinnis L (2007), Nonmotorized Transportation Pilot Program Evaluation Study, Active Communities Transportation Research Group and the Center for Transportation Studies, University of Minnesota (www.cts.umn.edu); at www.cts.umn.edu/Publications/ResearchReports/pdfdownload.pl?id=904
• Lee A and March A (2010), "Recognising The Economic Role Of Bikes: Sharing Parking In Lygon Street, Carlton," Australian Planner, Vol. 47, No. 2, pp. 85 - 93; at http://dx.doi.org/10.1080/07293681003767785; also see http://colabradio.mit.edu/wp-content/uploads/2010/12/Value_of_Bike_Parking_Alison_Lee.pdf
• Pivo G and Fisher JD (2011), "The Walkability Premium In Commercial Real Estate Investments," Real Estate Economics (www.wiley.com/bw/journal.asp?ref=1080-8620), Vol. 39, Issue 2, pp. 185-219; www.u.arizona.edu/~gpivo/Walkability%20Paper%20February%2010.pdf
• Racca DP and Dhanju A (2006), Property Value/Desirability Effects of Bike Paths Adjacent to Residential Areas, Delaware Center For Transportation and Delaware DOT, University of Delaware (www.udel.edu); at http://128.175.63.72/projects/DOCUMENTS/bikepathfinal.pdf
• Rowe K (2013), Bikenomics: Measuring the Economic Impact of Bicycle Facilities on Neighborhood Business Districts, University of Washington; at https://docs.google.com/file/d/0B0xHj6OM3QVWMUxScjZuMndxVkk/edit?pli=1
.• Stantec (2011), Vancouver Separated Bike Lane Business Impact Study, City of Vancouver and the Vancouver Economic Development Commission; at www.vancouver.ca/ctyclerk/cclerk/20110728/penv20110728ag.htm
• Stopher PR and Greaves SP (2007), "Household Travel Surveys: Where Are We Going?" Transportation Research A, Vol. 41/5 (www.elsevier.com/locate/tra), June, pp. 367-381.
• Sztabinski F (2009), Bike Lanes, On-Street Parking and Business A Study of Bloor Street in Toronto's Annex Neighbourhood, The Clean Air Partnership (www.cleanairpartnership.org); at www.cleanairpartnership.org/pdf/bike-lanes-parking.pdf
11. Economic considerations (case studies)
Beyond the economic considerations of health savings, as already discussed, tracks and trails have been shown to have direct economic consequences on employment and business activity as a result of spending. Some of these tracks represent multi-day walks and rides, whilst others just represent a trail through urban areas. Spending is frequently based on individual activity, but can also include commercial operations and special events. The following are case presentations, some in Australia, whereas others are in New Zealand and North America. These have been chosen as they appear to encompass similar geographical and socio-economic demographic.
As discussed previously, active mode tourism tends to provide greater economic benefits per kilometer of travel than other forms of tourism. Heldt and Liss (2013) describe how different types of cycling tourists can affect economic activity: affluent bicycle tourists from other countries, and domestic tourists who would otherwise spend their holiday dollars elsewhere, contribute most to regional and national economic development. Such tourists tend to demand relatively high quality cycling facilities (comfortable and safe routes and trails) and visitor amenities (restaurants, hotels, attractions, etc.).
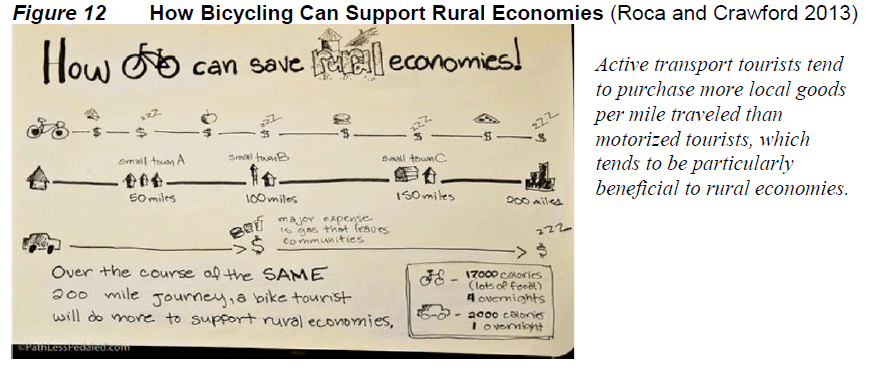
i. The Bibbulmun Track
The Bibbulmun Track is one of the world's great long distance walking tracks, stretching 963km from the eastern outskirts of Perth to Albany on the south coast of Western Australia. The track in its current form was opened in 1998, and a number of smaller scale projects to provide an indication of user numbers were undertaken by the (then) Department for Conservation and Land Management (CALM – now the Department of Environment and Conservation, DEC).
The key measure of usage of the track is the number of days spent on the track each year. The observational data suggests that around 434,736 visits are spent on the track each year. This represents an increase of 55% on the 2003 estimate of 280,000 days spent on the track.
40% of walkers had visited a campsite on their walk. Males (43%) were more likely than females (35%) to have done so; and younger walkers were more likely than older walkers to have visited a campsite. Based on the 167,206 walks estimated to take place on the track each year, multiplying these expenditure figures out suggests that around $39 million is spent each year as a result of walkers on the Bibbulmun Track. The 2003 estimate was approximately $21 million spent. The 2007-08 increase is due to the estimated number of visits, an increase in the spend of 4+ days visitors, and an increase in the proportion of the 4+ day visitors. The estimated total expenditure minus equipment is $28 million in 2007-08, up from $13 million in 2003. http://www.bibbulmuntrack.org.au/media/files/user_survey_results/2008_Bibbulmun_Track_User_Research_Report.pdf
ii. Quebec (Route Verte)
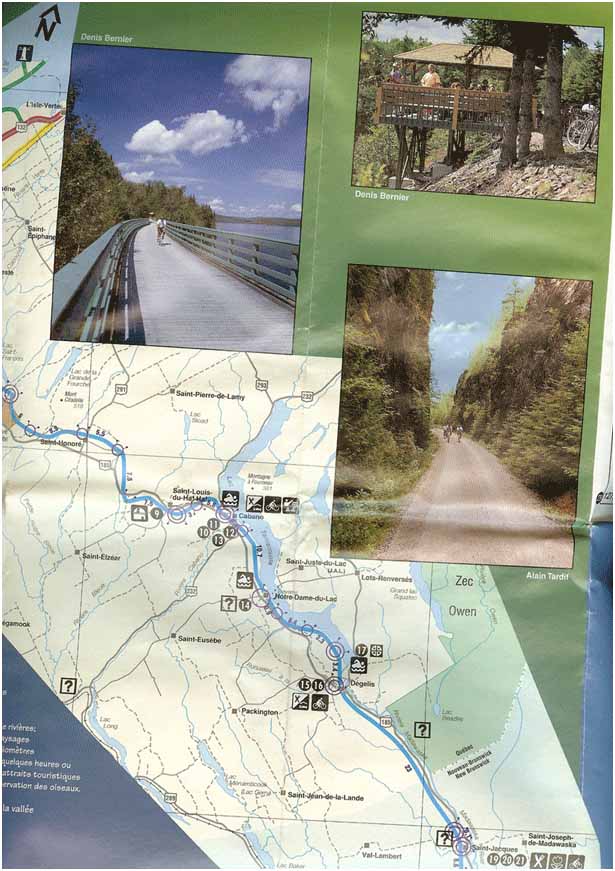
iii. Taupo (New Zealand) – the value of special events
When dividing the total economic input by population, Taupo stands out as a small town of 34000 people who have three major cycling events per year, generating $21 million per year.
Out of selected large cycling inclusive events, the event with the largest economic impact was the Contact Lake Taupo Cycle Challenge followed by Kellogg's Nutri-Grain Ironman New Zealand. Ironman New Zealand with a much smaller number of competitors than the Cycle Challenge, achieves a large impact because of the relatively long average length of stay of its event attendees, its significant number of international entrants and their higher daily expenditure. The overall impacts of selected large cycling-related event impacts were as follows:
• direct output (ie, expenditure without any flow-on effects) of $7.1 million;
• total output (ie, expenditure inclusive of all flow on effects) of $10.0 million;
• total value added (ie, value added inclusive of all flow on effects) of $3.8 million; and
• 73.7 FTE total jobs (ie, employment inclusive of all flow on effects) created or sustained.
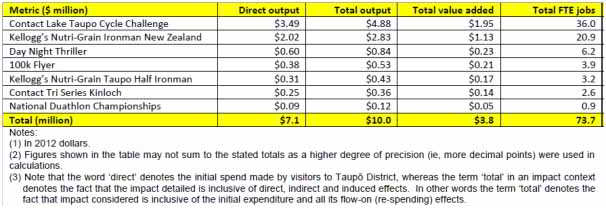
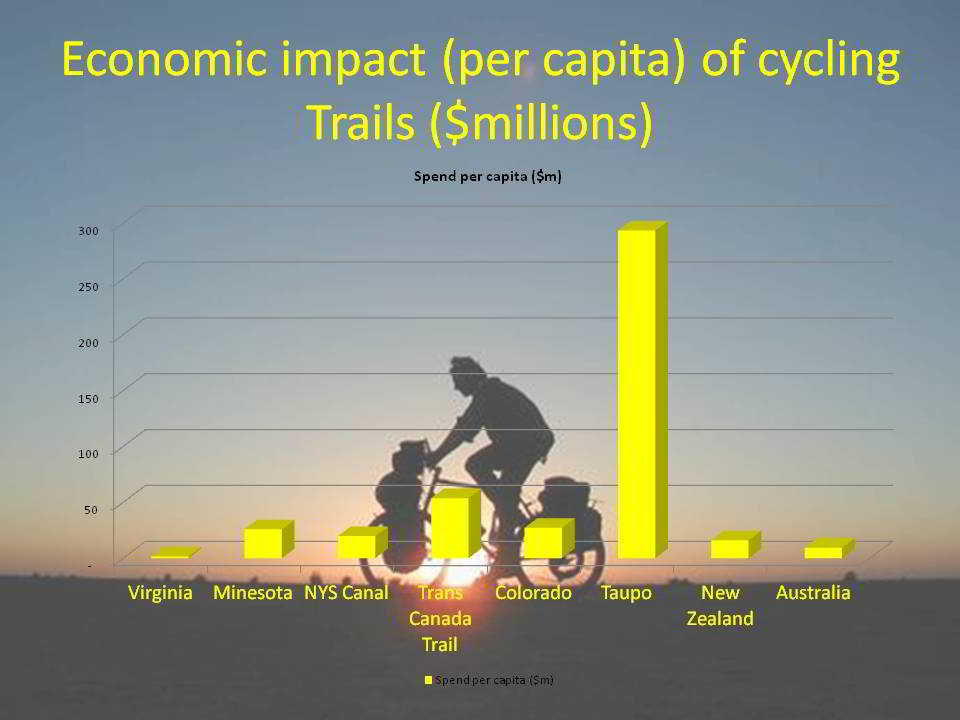
The largest annual impact in 2012 was made by events. The reason why the impact of events is relatively large is because they attract significant numbers of out-of-town entrants across a wide range of abilities, experience and ages. Entrants are generally accompanied by a significant number of friends, family and support staff, with the overwhelming majority of these making multiday overnight visits, rather than day visits.
iv. Bright (Victoria)
The Murray to the Mountains Rail Trail in Victoria brings an estimated $1 000 000 in tourism alone. It is 98km in length and was a feature article in the Australian Geographic during 2004. La Trobe University Associate Professor Sue Beeton released the results of a further study into the economic effects of Regional Communities and Cycling which indicated that in 2006 the average cyclist spends a total of $258.- per person per day ! This is up from $203.- in 2003. Additionally, it was found that the 8300 Easter visitors alone contributed $2,141,400 to the local community. This represented 21.6 F/T jobs being created by the Easter visitations.
The report concludes :
"Rail Trails provide outstanding opportunities for tourism and recreation, and can encourage outdoor activities and exercise due to the relatively gentle nature of the gradients and the attractive places many pass through. The also provide economic opportunities for the local host communities as well as the increased pride 'showing your place' to visitors creates. However they require not only funds to be developed, but significant maintenance support. In addition, local businesses and communities need to proactively develop, manage and promote the Trails to their markets. Successful tourism does not simply happen – it must be planned for and managed for the long term."
"they develop stronger, healthier, more active communities.......socially, economically and environmentally the concept was given the thumbs up in a recent report in the USA looking into the benefits for communities of having rail trails for biking, walking and jogging" (Australian Geographic April-June 2004, p75).
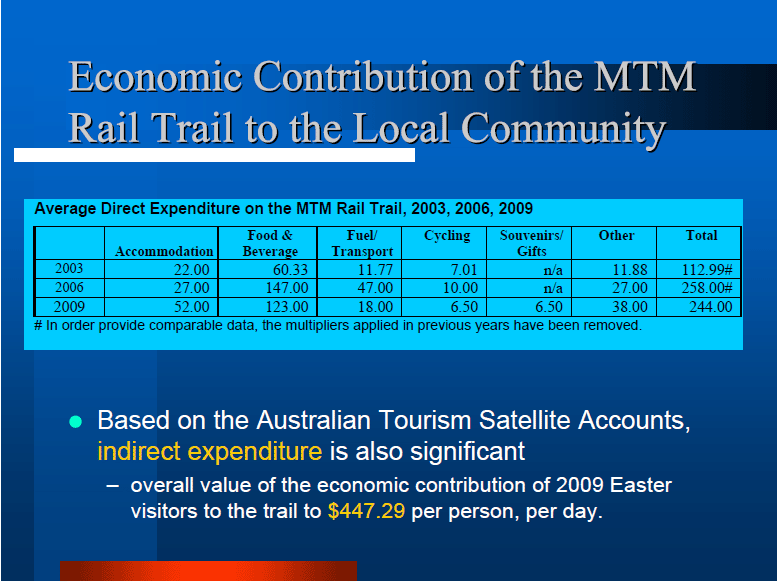
(Sue Beeton 2009)
v. Otago Rail Trail
The Otago Central Rail Trail (ORCT) was established in February 2000 through a cooperative effort between the Department of Conservation and the Otago Central Rail Trail Trust. Located in Central Otago, the 150 km recreational rail trail was built upon Central Otago's historic railway foundations. The rail trail (west from Middlemarch) travels along the Taieri River and through the Maniototo Plains; crosses the Rock and Pillar, North Rough, and Raggedy Ridge ranges; and passes through Ida Valley and Poolburn Gorge along the Manuherikia River. A trip along the entire 150 km length of the Otago Central Rail Trail may begin at either end of the trail, at Clyde or Middlemarch, and cycled in approximately 4 days, walked in approximately 6 days, or experienced by any number of shorter Station to Station trips. The OCRT's highest point is near the township of Wedderburn, 618 m above sea level, with gentle descents in either direction. Whether engaged in a multi-day excursion or a one day trip, a large selection of accommodation providers, restaurants, and other businesses support rail trail visitors both in communities adjacent to the rail trail and at nearby off-trail locations.
In a survey (2008) the majority of respondents stated that the OCRT has a significant impact on their businesses. Likewise, although some respondents reported business growth over the past three years, the slight overall decrease in business growth since 2005 was attributed to increases in petrol prices, more competition and fewer overseas visitors. The changes in visitor demographics suggested by respondents indicate that there has been a change to younger visitors (36-50 years of age), medium sized groups (three to four), and cyclists. These visitors are becoming the dominant rail trail visitors who patronise the businesses. The majority of reported rail trail users are from the North Island, New Zealand. Since 2005, trends indicate a slight decline in overseas visitors from Europe and the UK; however, there is a significant increase in visitors from Australia. Word of mouth and the OCRT website are the most common means of bringing OCRT visitors into contact with businesses. Business owners in 2008 attributed more of their turnover to OCRT users than they did in 2005, thus increasing the importance of marketing the OCRT to this visitor population. Business owners indicated that the rail trail's impact on the community brings 'Greater Community Pride' and 'Increased Employment'.

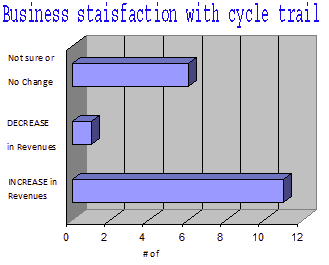
http://www.otagocentralrailtrail.co.nz/pdf/reports/Report-2008.pdf
vi. Comparative spending per trail
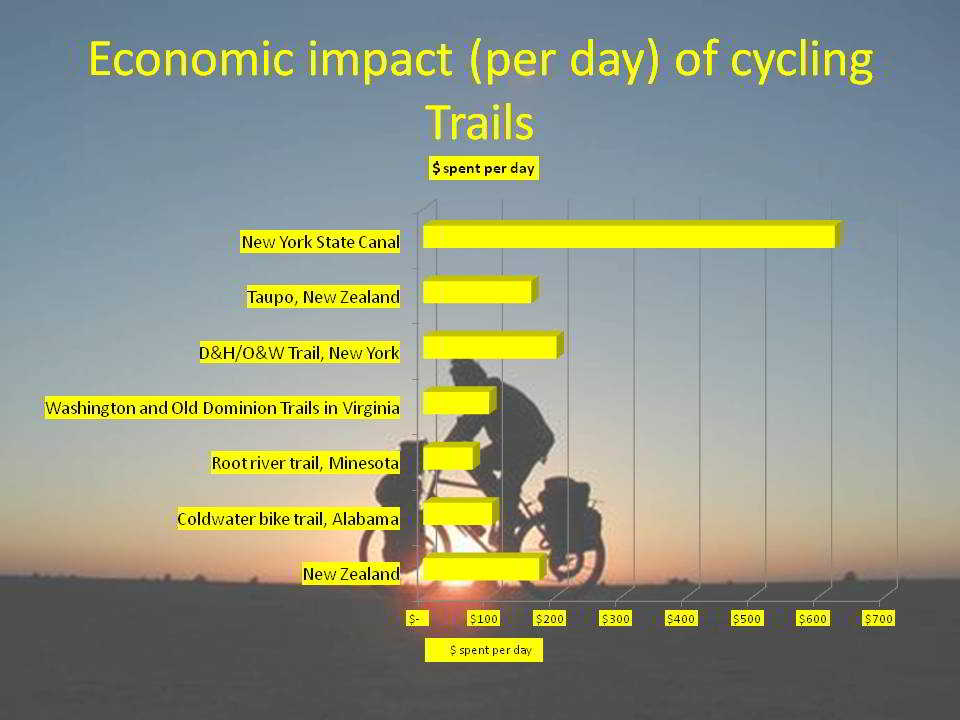
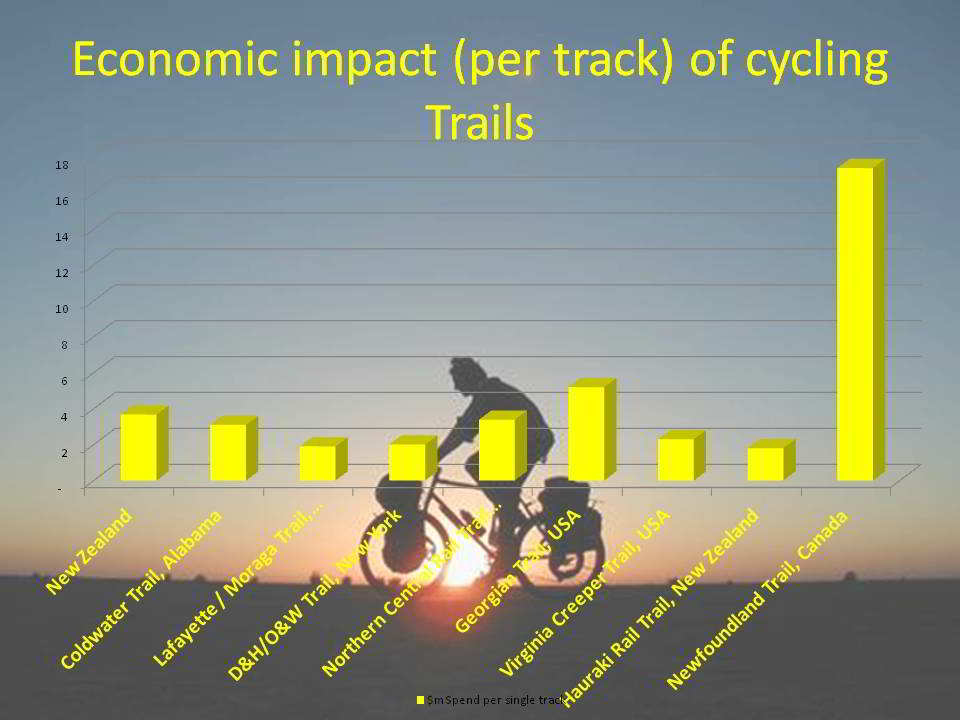
vii : Real Estate prices - Derby, North Eastern Tasmania
In September 2021, a dilapidated 2 bedroom 100 year old shack sold, in Derby, Tasmania for a record $1.3 million. 10 years previously it had sold for $160 000. The real estate agent was quoted as saying "I've never had so many calls about a property before … I would have easily had hundreds of calls and texts and emails." This news made national headlines : https://www.abc.net.au/news/2021-08-31/derby-crack-house-sells-for-1-3-million/100419092
Derby, in Tasmania, is an example of how mountain biking can kick-start an economy. “A ghost town of just 173 people just three years ago, Derby is now a renowned MTB hotspot that generates $23 million a year.”
https://www.mtba.org.au/wp-content/uploads/CCJ17427-Blue-Derby-Case-Study.pdf
12. Blue Mountains projected economic impact of cycle touring (pack cycling)
Overnight stays seem to have the greatest economic impact from cycle touring. The GBMCT is a trail which would cover close to 70km and if combined with the Wolgan Valley Rail Trail would represent over 100km of trail. Camping along the way could occur in the Blue Mountains National Park at Euroka clearing (Glenbrook), Murphys Glenn (Woodford), Ingar Picnic area (Wentworth Falls), at caravan parks in both Katoomba and Blackheath, and again at camping sites on Newnes Plateau and in the Wolgan valley (not far from the 6 star Emirates Resort). Other accommodation choices include Youth Hostels, Backpackers, B&B's, and hotels ranging up to 5 stars. A wide range of culinary possibilities exist at numerous restaurants, cafes and take away. Access to the region is well served for the most part by rail and road in order to commence and finish the cycling journey. Experiences in New Zealand suggest that local entrepreneurs develop transport services where they are needed. This may indeed become the case, if the trail finishes in the Wolgan Valley, where cyclists do not wish to ride back to Lithgow or on to Mudgee, a local entrepreneur may develop a pick-up drop-off or even food depot service. Several outdoor Adventure companies operate in the Mid and Upper Mountains. Additionally, a bike store exists in Wentworth Falls. In comparison, both Rotorua and Taupo have over 5 bike stores each, effectively competing within a few blocks from each other, servicing the tourist industry. Since cyclists enjoy outdoor pursuits, it is likely that they will also be attracted to other outdoor recreational activities such as abseiling, canyoning, rock climbing and hiking.
Australian Outdoor magazine (March/April 2007; p66) rated The Upper Blue Mountains as one of the top 10 destinations for outdoors recreational activity in Australasia! Imagine if this iconic tourist destination was linked through a cycling trail from East to West, making it one of the worlds most sort cycle touring destinations!
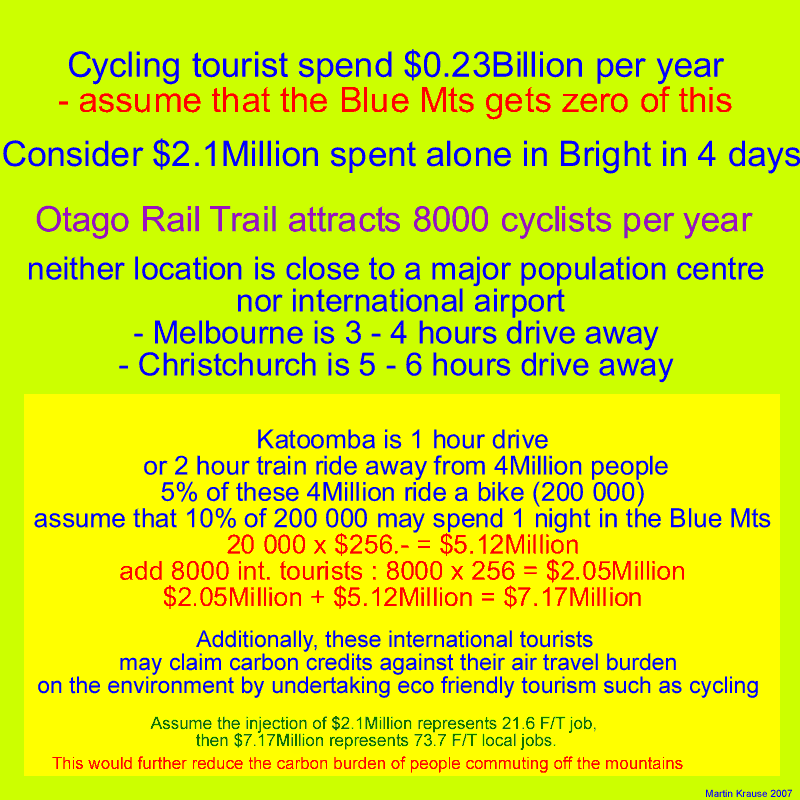
Central West Cycle Trail 2020-2021
The analysis of the economic impact of the Central West cycling trail is currently under way. It was instigated in 2020-2021. Just take a look at their Facebook site to see it's popularity with cyclists and non-cyclists alike. It even got a double page spread in the Sydney Morning Herald.
https://www.facebook.com/centralwestcyclingtrail/
13. Environment
Switching from motor vehicles to bicycles can dramatically reduce our carbon footprint. Climate change is arguably the most pressing issue facing the world today. To help tackle this crisis, the Australian Government currently has a target to reduce the country's carbon emissions by between 5% and 15% below 2000 levels by 2020. If a global agreement on a an ambitious deal to stabilise levels of greenhouse gases in the atmosphere at 450 parts per million CO2 equivalent or lower is reached, the Government has committed to increase its carbon emissions target by an additional 10%.(Commonwealth Department of Climate Change and Energy Efficiency, website,
http://www.climatechange.gov.au/en/government/reduce/national-targets.aspx)
In either scenario, these are ambitious targets and all members of society need to play their part in helping Australia achieve them. By reducing reliance on transport options with a larger environmental footprint, such as motor vehicles, cycling offers a low cost mechanism for reducing emissions that can be readily deployed. Between September 2008 and 2009, transport was responsible for almost 15% of Australia's carbon emissions, a total of 79 Mt CO2-e and an increase of 5% since 2000. (Commonwealth Department of Climate Change and Energy Efficiency: Quarterly Update of Australia's National Greenhouse Gas Inventory September Quarter 2009, http://www.climatechange.gov.au). As a zero emission mode of transport, cycling should be a key component of any future emissions reduction strategy. Even a small reduction in short vehicle trips can generate a significant reduction in emissions; shifting 5% of car trips to bicycle could reduce emission impacts by up to 8%.(Victoria Transport Policy Institute: Energy Conservation and Emission Reduction Strategies, http://www.vtpi.org/tdm/tdm59.htm)
Motor vehicle emissions are projected to increase significantly over the next ten years. Furthermore, motor vehicles are major contributors to the production of air pollutants, such as carbon oxides and sulphur oxides, which are widely known to contribute to chronic disease and respiratory ailments.
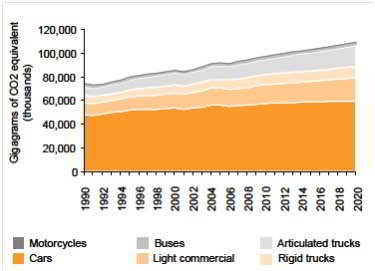
14. Energy Conservation
Motor vehicle production and use consume large amounts of natural resources, particularly energy such as petroleum and coal (Chester and Horvath 2008). This consumption imposes various external costs, including economic and national security impacts from dependence on imported petroleum, plus environmental and health damages from pollution. As a result, resource conservation can provide various benefits (NRC 2009).
Active transport can provide relatively large energy savings because it tends to substitute for short urban trips that have high emission rates per mile due to cold starts (engines are inefficient during the first few minutes of operation) and congestion. As a result, each 1% shift from automobile to active travel typically reduces fuel consumption 2-4% (Komanoff and Roelofs 1993). In addition, as previously described, active transport tends to have leverage effects, so comprehensive programs to improve walking and cycling can provide additional energy conservation benefits.
Evaluation methods: Petroleum consumption external costs are estimated to be 1-4¢ per vehicle-mile ("Resource Consumption External Costs," Litman 2009; NRC 2009), although possibly more to account for all environmental costs associated with petroleum extraction. Relatively high values are justified because non-motorized travel substitutes for short urban trips in which motor vehicles are fuel inefficient due to cold starts and congestion.
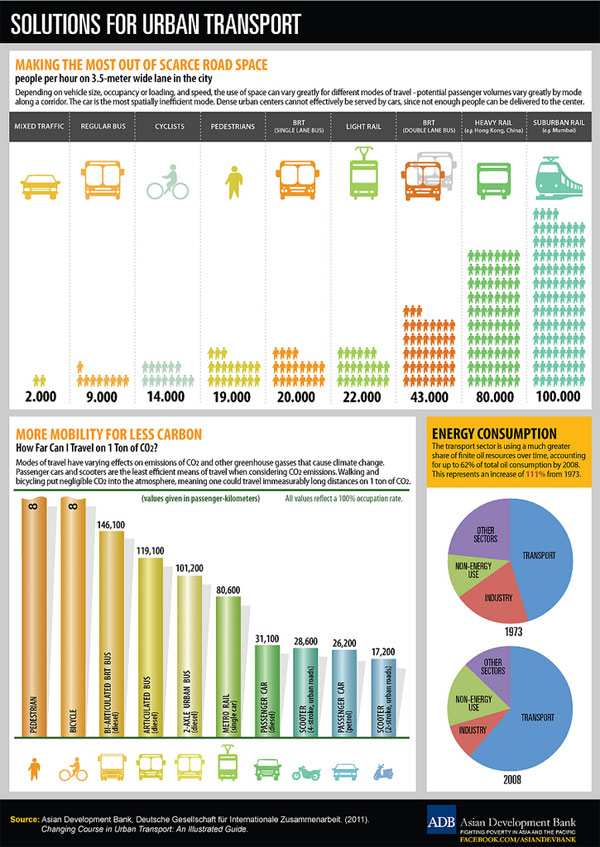
Citations
• Chester M and Horvath A (2008), Environmental Life-cycle Assessment of Passenger Transportation: A Detailed Methodology for Energy, Greenhouse Gas and Criteria Pollutant Inventories of Automobiles, Buses, Light Rail, Heavy Rail and Air v.2, UC Berkeley Center for Future Urban Transport, (www.its.berkeley.edu/volvocenter/), Paper vwp-2008-2; at www.sustainable-transportation.com.
• Komanoff C and Roelofs C (1993), The Environmental Benefits of Bicycling and Walking, National Bicycling and Walking Study Case Study No. 15, USDOT; at http://atfiles.org/files/pdf/BikePedBen.pdf.
• Litman T (2009), Transportation Cost and Benefit Analysis Guidebook, VTPI (www.vtpi.org/tca).
• NRC (2009), Hidden Costs of Energy: Unpriced Consequences of Energy Production and Use, National Research Council (www.nap.edu/catalog/12794.html).
15. Pollution Reduction
Motor vehicle production and use result in air, noise and water pollution which harm people, agricultural and the natural environment (Chester and Horvath 2008; TC 2008). Some pollutants, such as noise, carbon monoxide and particulates, have local impacts so their costs vary depending on where emissions occur, while others, such as ozone, methane and carbon dioxide, have regional and global impacts ("Air Pollution," Litman 2009). Walking and cycling produces virtually no pollution. Per mile emission reductions tend to be relatively large when active modes substitute for short urban trips which have high emission rates due to cold starts and congestion. Pedestrians and cyclists are exposed to vehicle pollution, although no more than motor vehicle occupants (Frank, et al. 2010).
Estimated Benefits: Various studies quantify and monetize motor vehicle pollution damages, but many of these estimates include only a limited portion of total pollution costs. For example, some consider ozone, CO and NOx damages but ignore particulate and air toxic damages, so total costs are higher than most published estimates (van Essen 2004). Automobile air, noise and water pollution costs are typically estimated to average 2¢ to 15¢ per vehicle-mile, with lower-range values in rural conditions and higher values under congested urban conditions, but relatively high values can be justified to reflect the tendency of walking and cycling to reduce short urban trips (Delucchi 2007; Litman 2009; TC 2008; Vermeulen, et al. 2004). A British study estimates that shifts from driving to active modes provide air pollution reduction benefits of £0.11 in urban areas and £0.02 in rural areas, with higher values for diesel vehicles (SQW 2007). A reasonable estimate is 10¢ per mile for urban-peak driving, 5¢ for urban off-peak and 1¢ for rural driving.
Citations
• Chester M and Horvath A (2008), Environmental Life-cycle Assessment of Passenger Transportation: A Detailed Methodology for Energy, Greenhouse Gas and Criteria Pollutant Inventories of Automobiles, Buses, Light Rail, Heavy Rail and Air v.2, UC
• Delucchi M (2005), The Social-Cost Calculator (SCC): Documentation of Methods and Data, and Case Study of Sacramento, Sacramento Area Council of Governments (SACOG) and the Northeast States for Coordinated Air-Use Management (NESCAUM), UCD-ITS-RR-05-37, (www.its.ucdavis.edu/publications/2005/UCD-ITS-RR-05-37.pdf).
• Frank L, Devlin A, Johnstone S and van Loon J (2010), Neighbourhood Design, Travel, and Health in Metro Vancouver: Using a Walkability Index, Active Transportation Collaboratory, UBC (www.act-trans.ubc.ca); at www.act-trans.ubc.ca/documents/WalkReport_ExecSum_Oct2010_HighRes.pdf.
• SQW (2007), Valuing the Benefits of Cycling: A Report to Cycling England, Cycling England, UK Department for Transport (www.dft.gov.uk); at www.dft.gov.uk/cyclingengland/site/wp-content/uploads/2008/08/valuing-the-benefits-of-cycling-full.pdf.
• TC (2008), The Full Cost Investigation of Transportation in Canada, Transport Canada (www.tc.gc.ca/eng/policy/aca-fci-menu.htm); at www.tc.gc.ca/media/documents/policy/report-final.pdf.
• Todd Litman (2009), Transportation Cost and Benefit Analysis Guidebook, VTPI (www.vtpi.org/tca).
• van Essen HP et al (2007) Methodologies For External Cost Estimates And Internalization Scenarios: Discussion Paper For The Workshop On Internalisation On March 15, 2007, CE Delft (www.ce.nl); at www.ce.nl/4288_Inputpaper.pdf.
• Vermeulen, et al. (2004), The Price of Transport: Overview of the Social Costs of Transport, CE Delft (www.ce.nl); at www.ce.nl/index.php?go=home.showPublicatie&id=181.
16. Conclusion
The GBMCT represents a unique proposition for developing active communities across a wide range of socio-economic demographics due to it's proximity to a major urbanised city and it's connectivity to communities in the Blue Mountains, wilderness and rural NSW countryside. Although the cost to build the Upper Blue Mountains section of the GBMCT is estimated at $7.5 million, it can be argued that comparative data from Australia and around the world, demonstrate incredibly large returns on investment (ROI) where such projects have taken place. Indeed, the New Zealand government began planning and building cycling trails across the country, as an economic stimulus, in reaction to the GFC. In 2014, it opened the Timber Trail, which is an 80km trail through the mountain range west of Lake Taupo. It alone cost $85 million but has a projected economic impact far in access of that value.
If other countries and indeed other states in Australia, can have the courage and economic modelling forecasting capacities to build cycle trails then it beggars disbelief that NSW cannot. In fact, NPWS completed a cycle trail improvement program in Glenbrook mid 2014, thus showing that trail building expertise does exist in NSW and moreover it demonstrates that their 'user needs analysis' supported the commitment of funding to the Oaks fire trail, which is part of the Great Blue Mountains Trail. The Upper Blue Mountains is an iconic tourist destination, where it is highly likely, a certain demographic of people would stay longer and hence spend more money and create a greater economic impact if a cycle trail were constructed. In light of the socio-economic stressors in the Upper Blue Mountains, a monetary input ($250 per day per person) from cycle tourism will stimulate the local economy, thereby creating jobs. Furthermore, the presence of cycling infrastructure which encourages active lifestyles are likely to have an economic impact on the health burdens of high mental illness rates, high rates of coronary artery disease and premature death which are present in the Upper Blue Mountains.
Currently, the BMCC has undertaken remediation work of the track between Medlow Bath and Blackheath. It also intends to commence construction of the Katoomba to Medlow Bath trail, in September 2014, with estimated completion early 2015. What is required is upgrading and sealing of these tracks. Furthermore, the already partially opened track along the western side of the rail corridor between Blackheath and Mt Victoria needs to be completely opened for cycle touring and commuting use. In reality, the latter is the least costly requirement to complete the Trans Mountains Trail, as it represents just a few kilometres of fencing and remediation. Although, Trails beside Rails exist in the form of the Parramatta to Liverpool cycle trail, the opening of this rail corridor to cyclists appears, from previous correspondence, to require the most bureaucratic good will, as their arguments, presented so far, have demonstrated no evidence to support their claims. In fact they represent stock standard responses with no technical analysis and are based on a 'business as usual' mentality.
https://www.communityrun.org/petitions/upper-blue-mountains-cycling-trail
https://www.facebook.com/groups/176565649208791
2020
Proposed Wolgan Valley Rail Trail - part of the Greater Manly - Mudgee cycling trail vision
Link to the proposed Kandos - Mudgee Rail Trail : part of the greater vision of "Mudgee to the sea"
http://www.railtrailsnsw.com.au/wp-content/uploads/2014/06/Gulgong-Mudgee-Kandos-RT.pdf
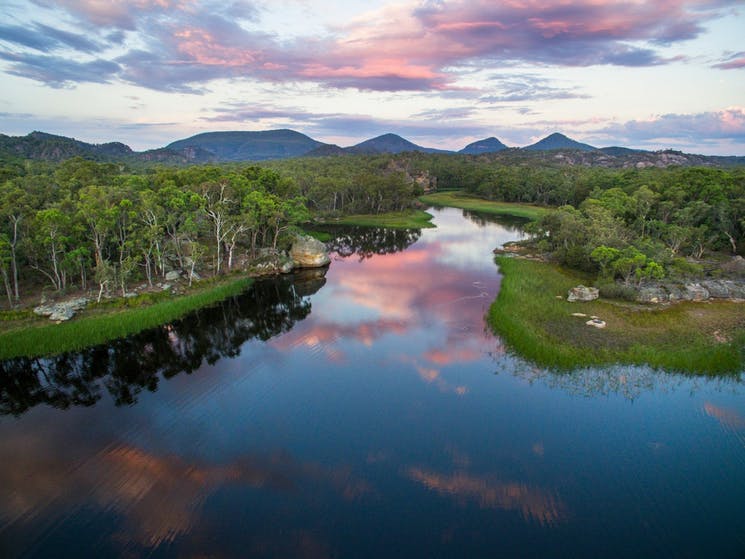
https://www.visitnsw.com/destinations/country-nsw/mudgee-area/rylstone/attractions/dunns-swamp
Clandulla and Dunn's Swamp
https://www.facebook.com/centralwestcyclingtrail/
In 2010
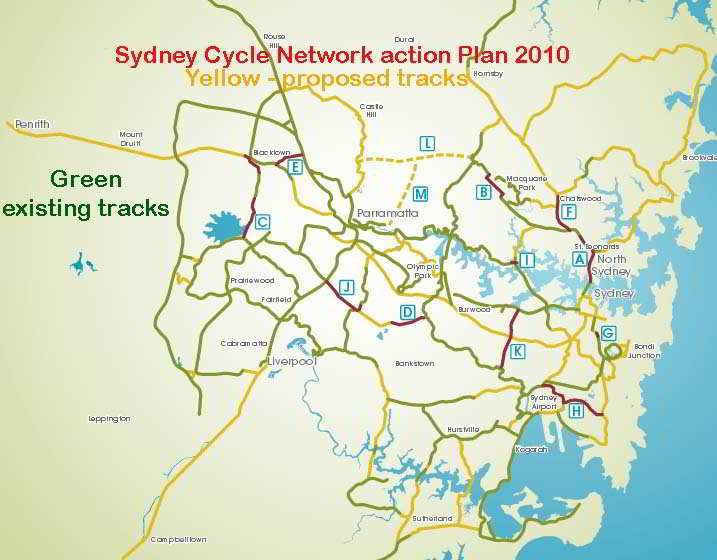
Where are we now?
Take the initiative and become part of the movement for sustainable healthy cycle tourism.
This is what can be done : Tumbarumba - Rosewood Rail Trail : opened in 2020
https://www.facebook.com/tumbarumbarailtrail
A long hard struggle with many ridiculous conservative thinking impediments in the way of progress. You can be part of the grass roots solution to create positive change for our future and the future of the next generation. Below is another active community in need of a rail trail
Citations for health
• Allatt, T., Turner, S., Tarjomi, L. 2012. What shoppers want: design for economic vitality. Presentation to IPENZ Transportation Conference, Rotorua, March 2012. Available: http://hardingconsultants.co.nz/ipenz2012/downloads/1140_Turner__Shane.pdfAccessed 29.5.12.
• Australian Bicycle Council and Cycling Promotion Fund. 2011. Australian cycling: an economic overview. Fact sheet. Available: Accessed 29.5.12.
• Badland, H.M., Oliver, M., Kearns, R.A., Mavoa, S., Witten, K., Duncan, M.J., Batty, G.D. 2012. Association of neighbourhood residence and preferences with the built environment, work-related travel behaviours, and health implications for employed adults: findings from the URBAN study. Social Science and Medicine 75(8), 1469-1476.
• Bauman, A., Rissel, C., Garrard, J., Ker, I., Speidel, R., & Fishman, E. 2008. Cycling: getting Australia moving. Barriers, facilitators and interventions to get more Australians physically active through cycling. Melbourne: Cycling Promotion 29 Fund. Available:
• Boarnet, M. G., Greenwald, M., & McMillan, T. E. 2008. Walking, urban design, and health: towards a cost-benefit analysis framework. Journal of Planning Education and Research, 27(3), 341-358.
• CABE: Commission for Architecture and the Built Environment. 2007. Paved with gold: the real value of good street design. London: CABE. Available: http://webarchive.nationalarchives.gov.uk/20110118095356/http:/www.cabe.org.uk/files/paved-with-gold.pdfAccessed 7.12.12
• Cavill, N., Kahlmeier, S., Rutter, H., Racioppi, F., & Oja, P. 2008. Economic analyses of transport infrastructure and policies including health effects related to cycling and walking: a systematic review. Transport Policy, 15, 291-304.
• Cortright, J. 2009. How walkability raises home values in U.S. cities. Chicago: CEOs for Cities. Available:
• Cycle to Work Alliance. 2011. Behavioural impact analysis. London: Cycle to Work Alliance. Available: Accessed 29.5.12
• Cycling England. 2010. Cycling England mid-term review 2008/9-2010/11. London: Cycling England. Available: http://www.ciltuk.org.uk/Portals/0/Documents/The%20Hub/policy/Cycling_England_Mid_Term_Review_2008_09_to_2010_11.pdf Accessed 7.12.12.
• Sudha Cugati, Jie Jin Wang, Elena Rochtchina and Paul Mitchell, 2007, Ten-year incidence of diabetes in older Australians: the Blue Mountains Eye Study, Med J Aust; 186 (3): 131-135
• Davis, A. 2010. Value for money: an economic assessment of investment in walking and cycling. Research Report 5. Bristol: Bristol City Council and NHS Bristol. Available: http://www.thinkingtransport.org.au/sites/www.thinkingtransport.org.au/files/EXt%20-%202010-3%20-%20Economic%20Assessent%20of%20Walking%20and%20Cycling%2C%20Dr%20Adrian%20Davis.pdf Accessed 13.11.12.
• de Hartog JJ, Boogaard H, Nijland H and Hoek G 2010, "Do The Health Benefits Of Cycling Outweigh The Risks?" Environmental Health Perspectives, doi:10.1289/ehp.0901747; http://ehp03.niehs.nih.gov/article/info%3Adoi%2F10.1289%2Fehp.0901747
.• Dratva, J., Zemp, E., Felber, D.D., Bridevaux, P.O., Rochat, T., Schindler, C., Gerbase, M.W. 2010. Impact of road traffic noise annoyance on health-related quality of life: results from a population based study. Quality of Life Research 19(1), 37-46.
• Econtech. 2007. Economic modelling of the net costs associated with non-participation in sport and physical activity: a report prepared by Econtech for Medibank Private. Canberra: Econtech. 30
• Fishman, E., Ker, I., Garrard, J., Litman, T. 2011. Cost and health benefit of active transport in Queensland. Research and Review, Stage One Report. Prepared by Catalyst for Health Promotion Queensland. Available: http://www.sensibletransport.org.au/sites/sensibletransport.org.au/files/u5/Executive%20Summary%2010.09.11%20V2.pdf Accessed 29.5.12
• Frumkin H. 2002. Urban sprawl and public health. Public Health Reports 117(3), 201-217.
• Gardiner L., Armstrong, B. 2007. Identifying sensitive receiving environments at risk from road runoff. Land Transport New Zealand Research Report 315. Wellington: New Zealand Transport Agency. Available: http://www.nzta.govt.nz/resources/research/reports/315/ Accessed 3.12.12.
• Garrett-Peltier, H. 2011. Pedestrian and bicycle infrastructure: a national study of employment impacts. Amherst, MA., Unversity of Massachusetts Political Economy Research Unit. Available: http://www.peri.umass.edu/fileadmin/pdf/published_study/PERI_ABikes_October2011.pdf Accessed 22.5.12.
• Genter, J. A., Donovan, S., Petren as, B., & Badland, H. M. 2008. Valuing the health benefits of active transport modes. New Zealand Transport Agency Research Report 359. Wellington: New Zealand Transport Agency. Available: http://www.nzta.govt.nz/resources/research/reports/359/docs/359.pdf Accessed 7.12.12.
• Giles-Corti, B., Knuiman, M., Pikora, T.J., Van Neil, K., Timperio, A., Bull, F.C., Shilton, T. et al. 2007. Can the impact on health of a government policy designed to create more liveable neighbourhoods be evaluated? An overview of the RESIDEntial Environment Project. NSW Public Health Bulletin 18(11-12), 238-242.
• Giles-Corti, B., Knuiman, M., Timperio, A., Van Neil, K., Pikora, T.J., Bull, F.C., Shilton, T. et al. 2007. Evaluation of the implementation of a state government community design policy aimed at increasing local walking: design issues and baseline results from RESIDE, Perth, Western Austrlia. Preventive Medicine 46(1), 46-54
• Gortmaker, S.L., Swinburn, B.A., Levy, D., Carter, R., Mabry, P.L., Finegood, D.T., Huang, T., et al. 2011. Changing the future of obesity: science, policy, and action. Lancet 378 (9793), 838-847.
• Gotschi, T. 2011. Costs and benefits of bicycling investments in Portland, Oregon. Journal of Physical Activity and Health 8 (Suppl 1), S49-S58.
• Guo, J.Y., Gandavarapu, S. 2010. An economic evaluation of health-promotive built environment changes. Preventive Medicine 50(Suppl 1), S44-S49. 31
• Haines A, Smith, K. R., Anderson, D., Epstein, P.R., McMichael, A.J., Roberts, I., Wilkinson, P. et al. 2007. Policies for accelerating access to clean energy, improving health, advancing development, and mitigating climate change. Lancet 370(9594), 1264-1281.
• Jarrett, J., Woodcock, J., Griffiths, U.K., Chalabi, Z., Edwards, P., Roberts, I., Haines, A. 2012. Effect of increasing active travel in urban England and Wales on costs to the National Health Service. Lancet 379(9832), 2198-2205
• Lindsay, G., Macmillan, A., Woodward, A. 2011. Moving urban trips from cars to bicycles: impact on health and emissions. Australian and New Zealand Journal of Public Health 35(1), 54-60.
• Litman, T. 2011. Economic value of walkability. Victoria, BC: Victoria Transport Policy Institute. Available: http://www.vtpi.org/walkability.pdf Accessed 7.12.12.
• Mackie, H. 2010. Improving school travel systems. Research Report 420. Wellington: New Zealand Transport Agency.
• Macmillan, A.K. 2012. Intervening in the trip to work. A system dynamics approach to commuting and public health. A thesis submitted in fulfilment of the requirements for the degree of Doctor of Philosophy in Community Health, University of Auckland.
• McDonald, B. 2007. Valuing the benefits of cycling: a report to Cycling England. London: Department for Transport. Available: http://webarchive.nationalarchives.gov.uk/20110407094607/http://www.dft.gov.uk/cyclingengland/site/wp-content/uploads/2008/08/valuing-the-benefits-of-cycling-full.pdf Accessed 7.12.12.
• Ministry for the Environment. 2012. New Zealand‟s greenhouse gas inventory 1990-2010. Available: http://www.mfe.govt.nz/publications/climate/greenhouse-gas-inventory-2012/greehouse-gas-inventory-2012.pdf Accessed 7.11.12
• New Zealand Transport Agency 2010. Economic evaluation manual. Volume 2. Wellington: New Zealand Transport Agency. Available: http://www.nzta.govt.nz/resources/economic-evaluation-manual/volume-2/docs/eem2-july-2010.pdf Accessed 7.12.12.
• New Zealand Public Health Association. Undated. Policy on physical activity. Available: http://www.pha.org.nz/policies/phapolicyphysactivity.pdf Accessed 27.9.12.
• Ogilvie, D., Foster, C.E., Rothnie, H., Cavill. N., Hamilton, V., Fitzsimons, C.F., Mutrie, N. 2007. Interventions to promote walking: systematic review. BMJ 334, 1204. 32
• Ogilvie, D., Mitchell, R., Mutrie, N., Petticrew, M., Platt, S. 2006. Evaluating the health effects of transport interventions: methodologic case study. American Journal of Preventive Medicine 31(2), 118-126
• Perdue, L.A., Michael, Y.L., Harris, C., Heller, J., Livingston, C., Rader, M., Goff, N.M. 2012. Rapid health impact assessment of policies to reduce vehicle miles travelled in Oregon. Public Health 126(12), 1063-1071
• Pivo, G., Fisher, J.D. 2010. The walkability premium in commercial real estate investiments. Tucson, AZ: University of Arizona Available: http://www.u.arizona.edu/~gpivo/Walkability%20Paper%208_4%20draft.pdf Accessed 29.5.12
• Rabl A and de Nazelle A (2012), "Benefits of Shift From Car to Active Transport," Transport Policy, Vol. 19, pp. 121-131; at www.citeulike.org/article/9904895.
• Rojas-Rueda, D., de Nazelle, A., Tainio, M., Nieuwenhuijsen, M.J. 2011. The health risks and benefits of cycling in urban environments compared with car use: health impact assessment study. BMJ 343, d4521 doi.
• Sælensminde K 2004, "Cost-Benefit Analysis of Walking and Cycling Track Networks Taking Into Account Insecurity, Health Effects and External Costs of Motor Vehicle Traffic," Transportation Research A, Vol. 38, No. 8 (www.elsevier.com/locate/tra), October, pp. 593-606; at
• Soloman, L., Cavill, N., Cope, A., Muller, L., Kennedy, A. 2009. Analysis and synthesis of evidence on the effects of investment in six Cycling Demonstration Towns: report for Department of Transport and Cycling England. London: Department for Transport. Available: http://webarchive.nationalarchives.gov.uk/20110407094607/http://www.dft.gov.uk/cyclingengland/site/wp-content/uploads/2010/03/analysis-and-synthesis-report.pdf Accessed 7.12.12
• Snyder, R. Undated. The economic value of active transportation: a fact sheet. Los Angeles, CA.: Ryan Snyder Associates. Available: http://www.rsa.cc/images/EconomicValueOfActiveTransportation.pdf Accessed 22.5.12.
• Swinburn, B.A, Sacks, G., Hall, K.D., McPherson, K., Finegood, D.T., Moodie, M.L., Gortmaker, S.L. 2011. The global obesity pandemic: shaped by global drivers and local environments. Lancet 378(3793), 804-814.
• Thomson, H., Jepson, R., Hurley, F., Douglas, M. 2008. Assessing the unintended health impacts of road transport policies and interventions: translating research evidence for use in policy and practice. BMC Public Health 8, 339.
• Tolley, R. 2011. Good for business: the benefits of making streets more walking and cycling friendly. Adelaide: National Heart Foundation of Australia. Available: Accessed 22.5.12.
• Trombulak , S.C., Frissell, C.A. 2000. Review of ecological effects of roads on terrestrial and aquatic communities. Conservation Biology 14(1), 18-30.
• Turner, S., Singh, R., Quinn, P., Allatt, T. 2011. Benefits of new and improved pedestrian facilities – before and after studies. Research Report 436. 33
• Wellington: New Zealand Transport Agency. Available: http://www.nzta.govt.nz/resources/research/reports/436/docs/436.pdf Accessed 8.11.12
• Urry, J. 2002. Mobility and proximity. Sociology – the Journal of the British Sociology Association 36(2), 255-274.
• US Department of Health & Human Services. 1996. Physical activity and Health: a report of the Surgeon General. Executive Summary. Atlanta, GA. US Department of Health & Human Services, Centers for Disease Control & Prevention, National Center for Chronic Disease Prevention and Health. Available: http://www.cdc.gov/nccdphp/sgr/pdf/execsumm.pdf Accessed 29.5.12
• Warburton, D.E., Nicol, C.W., Bredin, S.S. 2006. Prescribing exercise as preventive therapy. Canadian Medical Association Journal 174(7), 961-974.
• Woodcock, J., Edwards, P., Tonne, C., Armstrong, B.G., Ashiru, O., Banister, D., Beevers, S. et al. 2009. Public health benefits of strategies to reduce greenhouse-gas emissions: urban land transport. Lancet 364(9705), 1930-1943.
• World Health Organisation 2008. Health economic assessment tool for cycling (HEAT for cycling): user guide. Copenhagen: WHO Regional Office for Europe. Available: http://www.euro.who.int/__data/assets/pdf_file/0011/87482/E90948.pdf Accessed 5.12.12.
• Wu, S., Cohen, D., Shi, Y., Pearson, M., Sturm, R. 2011. Economic analysis of physical activity interventions. American Journal of Preventive Medicine 40(2), 149-158
Updated : 15 November 2021


